

Hello once again my people, today we shall look at EurAud multiple timeframe analysis.
I will try and focus on how I draw charts as I try to demystify how patterns can be used to come up with decisions that are key in trading.
Technical analysis has been useful to my team and myself and has worked for us for the few years we have been part of the game. It is therefore unto us to share the little information that we have.
This is solely because legacy is not what we will leave people with in bank accounts or inform of assets but what we will leave in people.
I will single out the Euro vs the Australian dollar ,technical analysis, because there is a trade-able set-up that we are also looking at for this coming week.
Please note that I prefer entering trades on 4 hour and 1 hour time frames. This helps me get away with the noise and concentrate on trades that can make me money in the long run.
We will also be focusing on the use of only one indicator which is the MACD. This however is not to be interpreted that this is a perfect indicator or the other indicators cannot be used when trading our strategy.
I hope to find time in the near future to solely discuss how we use the indicator.
Let’s start EurAud Multiple TimeFrame analysis;
Monthly Chart
The monthly “technical analysis” chart helps to give us long trends over long time periods.
We are able to identify different patterns also that help us to make decisions.The different patterns can also be found in our classes sections.
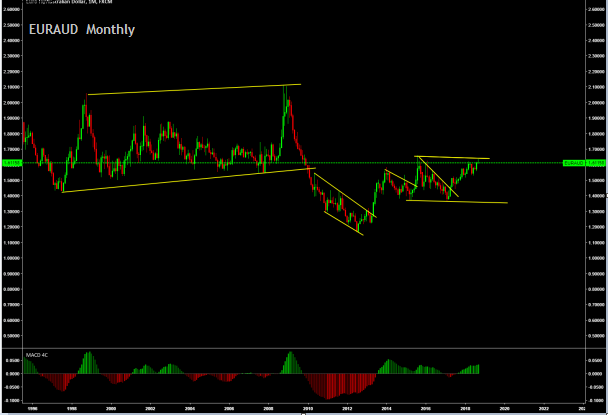
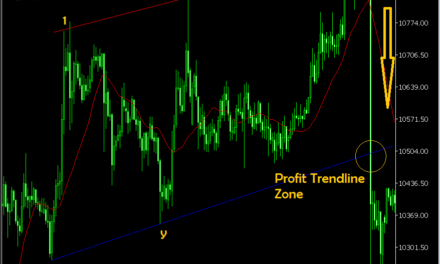
Please take your time and look at this section and go back to charts and identify the different patterns and the way they behave. I will attach at the end a photo on the different patterns for you to review.
In our current chart, it is easy to recognize that a flag is forming for an upward continuation to the top. It is also easy to note that we are at a high compared to recent years prices. I.e. basically we are at a level that was last reached in the year 2015.
WEEKLY CHART
The weekly “technical analysis” time frame breaks down what took place in the months into lower time frames.
In this chart we are again able to find smaller patterns that will help us identify the levels at which we are currently are and help us make trading decisions.
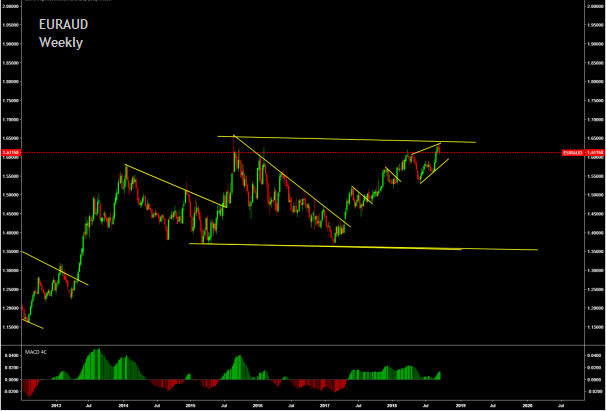
We also use the MACD to show us our future wave whenever there is a crossover.
MACD is also good in helping us count the waves. We however don’t take trades based on the indicators but only take trades when the impulse is starting.
DAILY CHART
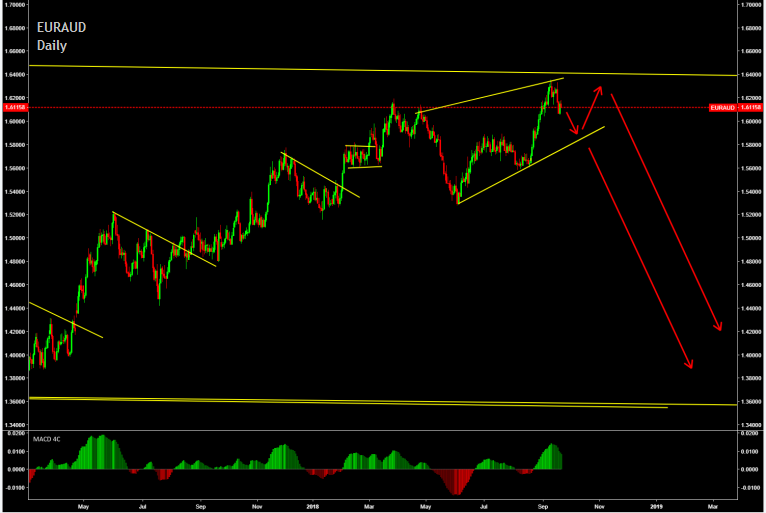
We can go on analysing the charts to 15 minutes for us to come up with a decision on whether to sell or buy. We will however end our analysis today on the daily chart and give a projection on what we expect this coming week..
.Please do not just click on sell. Please do not trade on a strategy that you do not fully understand. If you are going to enter this trade wait for correction on lower time frames before entering the trade.
Trade with care and all the best. I hope to see you soon once again.
Please feel free to comment on my articles. Your feedback is highly appreciated and will be treated with the respect it all deserves.
I would also love to hear on the topics that you could love the team to write about in upcoming articles. Have a lovely week and trade with care. Remember to risk only what you can afford to lose.
Best regards,
The shark.

