
It is very important to understand the larger context of the market as you trade. This can be done by analyzing the larger time frames support and resistance zones as you go down to the smaller time frames. Trades in direction of trend always perform much better than trades against the trend.
It is easier and takes little or no effort to swim with the stream flow than to swim against it.
In this article, we will discuss the major EUR/USD support and resistance zones to keep an eye on. We also discuss the price action on the currency pair for this new week to observe going forward.
Let’s start with an over view of the Monthly chart
Monthly EURUSD Chart

From our previous article, we deeply discussed the price action on the EURUSD currency pair. Currently you can clearly see price retraced back into S trendline support zone as shown in the chart below. There is also a 21 Simple Moving Average support. This makes this level a very important pivotal zone zone.
This means a strong reaction must be expected and in this case most likely a bounce back up. When there is a confluence of several factors like several support zones, it increases the probability for a setup.
However a monthly candle close below support S could lead price into previous lows support zone around 1.08290 marked by black horizontal line H. Resistance S and support T trend lines still remain critical zones . We will look at the details of the current price reaction on this zone on the lower time-frames below.
Daily EURUSD Chart
Our previous Daily chart analysis moved smoothly. We had price hit and break through all the support zones we discussed previously. Right now we back into the S trendline support zone as shown on the chart below. The S support trendline is one same as that on the monthly chart.

On the S monthly trendline support zone, we already see a bullish engulfing on the zone. This is the same zone as the previous lows. This is an added energy for the bounce back up. This can lead prices currency pair to higher prices. The immediate resistance target is around 1.17923 marked by red horizontal line.
Let us now look at the 4-Hour time frame to pinpoint some major levels for entry.
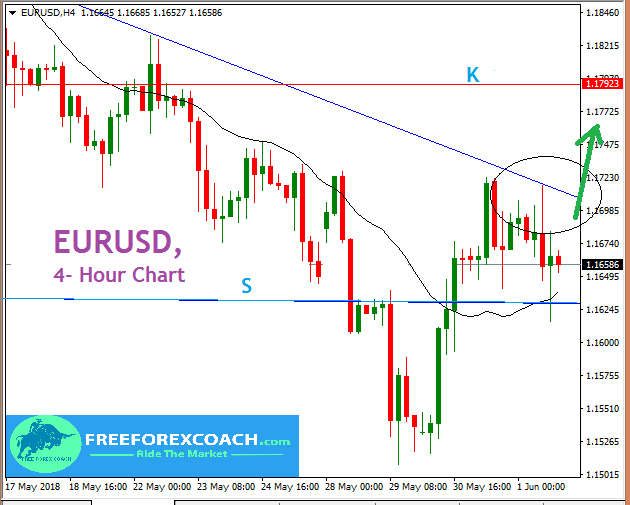
4- Hour EURUSD Chart
Here we will look at the proper build up of the candlesticks within the current price action. Let us take a look at the 4-Hour EURUSD chart below;

So we have price running along the blue trend line as we wait for any reaction. 4-Hour candle close above the small blue trend line will be confirmation for a buy. Candle confirmation may lead price into the immediate resistance around 1.17923 marked by the red horizontal line K.
Depending on the strength of the movement, we may see price aim for higher highs around 1.19336 resistance zone. This zone is also a strong pivotal zone holding previous price congestion movements.
I always emphasize the importance of trading smaller time-frames in relation to the larger time-frames. This is because it will always give you a larger market picture at the back of your mind. Knowing the larger market sentiment will improve your decision making.
This is why it is vital to always look at the larger time-frames like monthly and weekly charts to help you make decisions while trading small time-frames. These smaller time frames in this case i mean 4- hour, hourly, 30 minute etc.
All this helps you to trade in the major market direction once you have identified larger time frame support and resistance zones.
Happy Trading!

