
You can use Fibonacci extension as profit targets. Fibonacci extension/ expansions are used the same way we use Fibonacci retracements only that these are mainly used to determine levels of take profit.
What is a fibonacci extension/ expansion
Fibonacci extension is a technical analysis tool that traders can use to estimate how far a price may move after a retracement/pullback.
It is good to use fibonacci extension as profit targets because it predicts how far price could go. Once you know how far prices are likely to go in the market, you will be able to set realistic profit targets for your trades.
Common characteristics of Fib Extension
- Expansion levels are also possible areas where the price may reverse.
- These levels are based on Fibonacci ratios (as percentages).
- Common Fibonacci expansion levels are 61.8%, 100%, 161.8%, 200%, and 261.8%.
- The Fibonacci extension/expansions show how far the next price wave could move after a pullback/retracement.
The extensions help us to know how far a trend is likely to stretch after retracing the previous swing of the main trend.
Therefore, once you already have an entry point for your trade, you can use the Fibonacci expansion to set your profit target level.
With Fibonacci expansions, you will know when to exit trade and take profit.
How to plot fibonacci Extension on the chart
- If you are using the MT4/MT5 trading platform, on your chart, go to the left upper corner on the first row of the tool bar.
- Click on insert option, it will drop a list of tools. Move your cursor to Fibonacci, then select expansion/extension.
- Now move the cursor to the chart to the point where you want to plot. With it, it carries a small icon like a Fibonacci shape. click on the point you chose then drag to extend to the next point.
Let’s take a look a live chart and see how we can use extension/expansion levels to determine take profit levels.
How to use Fibonacci extension as profit targets
First let’s first identify our entry point levels using Fibonacci retracement. We are trading Fibonacci retracement strategy combined with candlestick patterns.
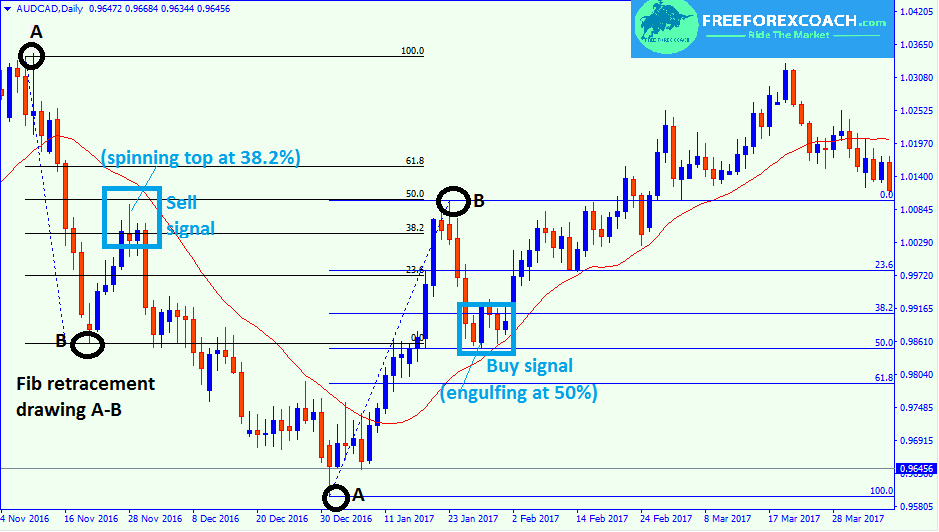
Click on the Fibonacci retracement icon on the platform.
Draw it on the chart by placing the cursor at point A and drag it down to point B as shown on our chart above.
Remember, you draw the Fibonacci retracement tool when you see a swing starting to retrace.
Then patiently wait for a confirmation signal for a bounce off the drawn levels. In the above example we have used the candlestick pattern confirmations
From our chart above, we have good signals for sell and buy entries.
The sell is as a result of a spinning top on on a Fibonacci retracement level,, 38.2%.
The buy signal is due to the formation of a bullish engulfing at the 50% retracement.
Now that we have taken the trades, all we need is to know the suitable levels where we can book ourselves profits before time expires on us.
Qn: How?
Ans: Use Fibonacci extensions or expansions.
Extensions show us how far price is likely to move after retracing the previous swing.
As usual the platform provides it all for you should have no worries about how to calculate the extension levels.
Let’s get started.
Move your cursor to the left upper side of your chart.
if you don’t directly see the extension or expansion tool on your platform, click on the insert option.
Choose Fibonacci extension/expansion.
Some platforms have only Fibonacci expansion, it’s ok. You can use any!
Let’s now see how the expansion level targets would look on chart;
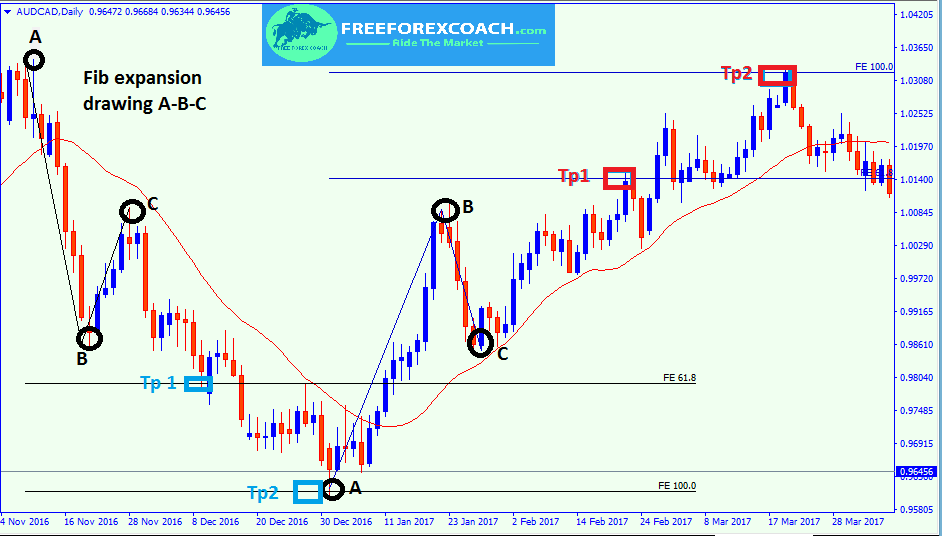
Drawing Fibonacci extension as profit targets.
- After picking the expansion too, place your cursor at point A hold and drag it to B.
- Double click on the expansion line and then pull to point marked C.
- Do the same for the second position
The common take profit targets (Tp) levels on the extension tool are 61.8 and 100% extension levels.
From the above chart, Take profit(TP) in blue is for the sell trade and Tp in red for the buy trade.
CONCLUSION
The extension of a trend can also depend on the strength of the trend and how deep it was retraced. Therefore, we want to know, how long price is likely to go after retracing point C
If the retracement is so deep, it may not make a big extension.
In addition, if you consider volatility in the market,and at the same time see how price respects the identified extension levels, you can tell when to exit the trade.
Fibonacci extensions also give the option for adding more levels in case price hangs in between the levels. You can add a level yourself(edit the tool) to identify the levels of support and resistance.
Just double click on the broken line of the Fibonacci expansion tool
Right click and choose expansion properties. Click on it and choose fib levels. go ahead and add the level you want. Add and click ok. That’s all.

How procrastination can affect your trading success?
Procrastination to trade is when your trading set up confirms and you hesitate to take trade. Or your trade show all failing signals and you hesitate to close trade to cut losses. Also, in cases, where you sometimes hesitate to take profit because you want to...
- Oh, bother! No topics were found here.

