
Using Fibonacci retracement with support and resistance can help you increase more chances for profits but can make wonders when combined .
At this level, we all know what support and resistance is and how to use it. The same applies to Fibonacci retracement. As of the fact, both are technical analysis tools and they all behave almost the same way.
First, let us look at how to draw support and resistance on the market chart.
How to draw support and resistance
- On your trading chart, go to the left upper side top of the chart, you will see a small horizontal line icon.
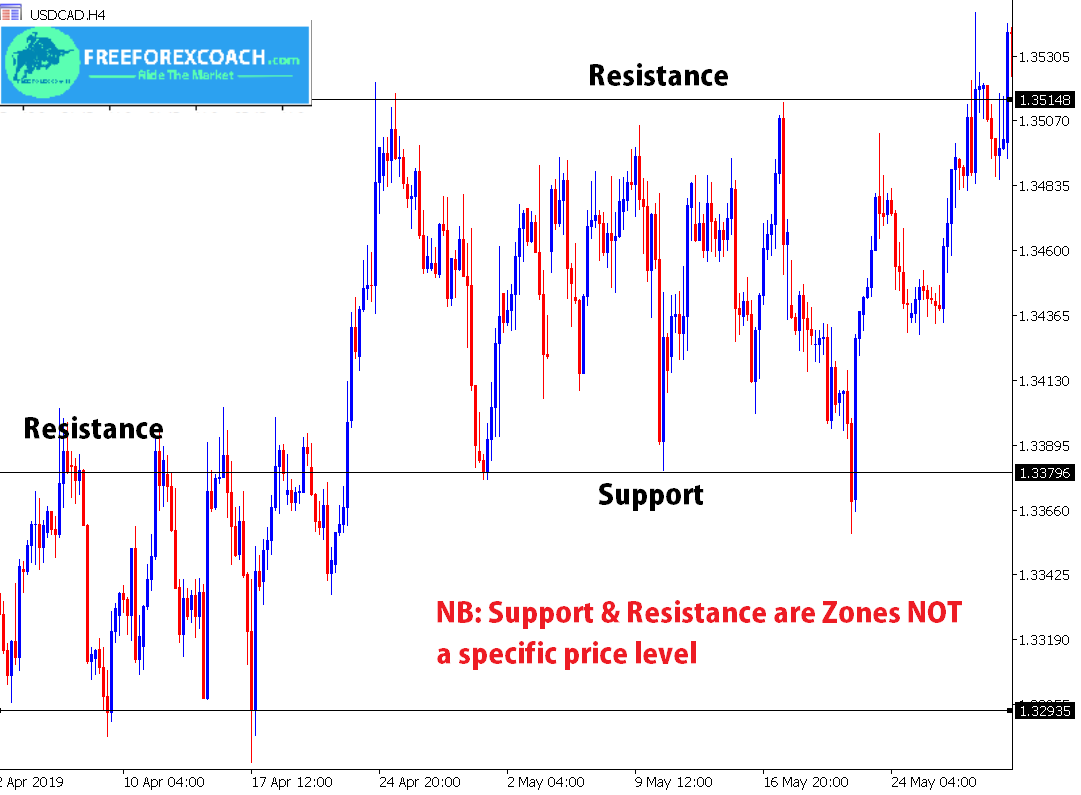
- Click on the icon and move the cursor to the chart. On your chart, check for the areas where price is resilient to continue in the main trend direction.
- To that level click and release the left click of your mouse. You will now have a horizontal line going through the selected level. If it covers at least 3 previous highs, it qualifies as a resistance.
- On the other hand if the horizontal line connects at least 3 previous lows, its a support.
- In case you want to adjust the support, place the cursor on the support/resistance line, double click and drag to your preferred level
- Also if you want to delete it, double click on it and press delete or after double click, right click and select delete.
You have drawn your support or resistance, lets now add the Fibonacci retracement.
How to draw a fibonacci retracement
Again, go to the top left side above on the chart, you will see a small dotted lines with an (F) below ![]() . Simply click on it and move your cursor towards your chart. Don’t drag it. Just move it.
. Simply click on it and move your cursor towards your chart. Don’t drag it. Just move it.
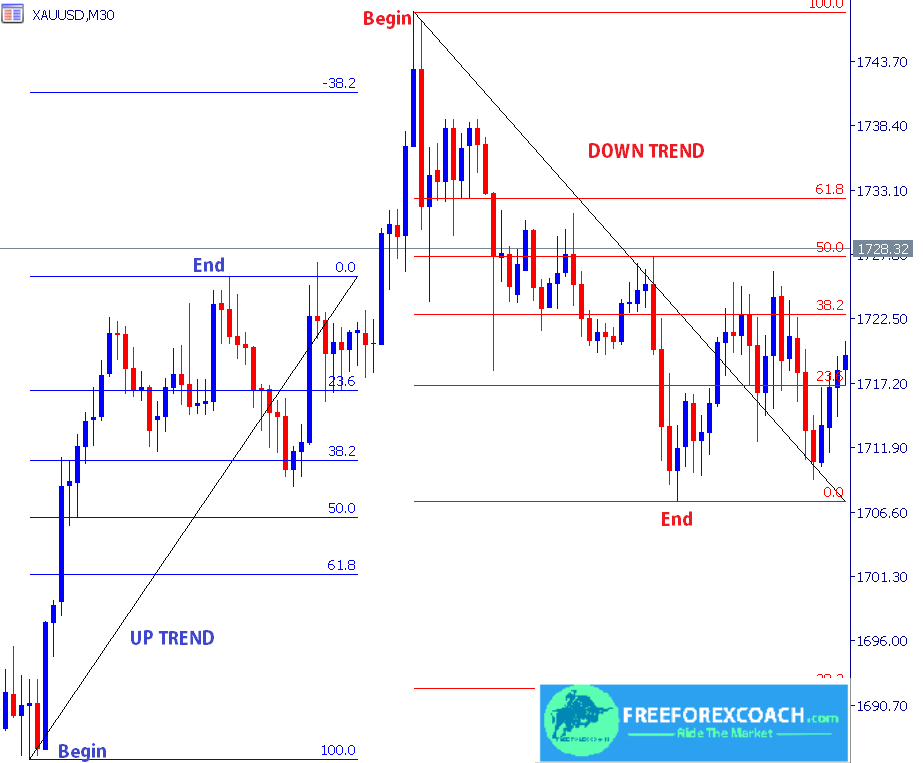
- For an uptrend, pick a lower low, place the Fibonacci icon, click, hold and drag upwards to connect to the higher swing. Then release the cursor/left click of the mouse.
- For a downtrend, pick a higher high, place the Fibonacci icon, click, hold and drag downwards to connect to the lower low swing.
- Then release the cursor/left click of the mouse.
- Fibonacci retracement levels will display on the chart.
Fibonacci retracement can help you to clearly spot support and resistance levels and see if they line up with retracement levels.
how to trade fibonacci retracement with support and resistance
Trading using Fibonacci retracement with support and resistance is quite easy. All you have to do is to wait for zones where both collide.
General rules to follow
- Mark a strong/resistance zone.
- Wait for a break out out of the zone.
- Draw the fib retracement levels on the break out swing. Note the zone coinciding with the support / resistance zone.
- Wait for price to bounce off the zone and take the trade.
Let us have a look at a few examples on how to trade fibonacci retracement with support and resistance.
SELL SETUP – Combine Fibonacci retracement with Support and Resistance
Take a look at the chart below;
Strong Support zone identified show by the horizontal line.
Price break outs and Fibonacci retracement drawn on the break out swing.
In this case the 38.2% level coincides with the support zone.
Wait for price to come back to the intersection zone.
Looking at the chart below;
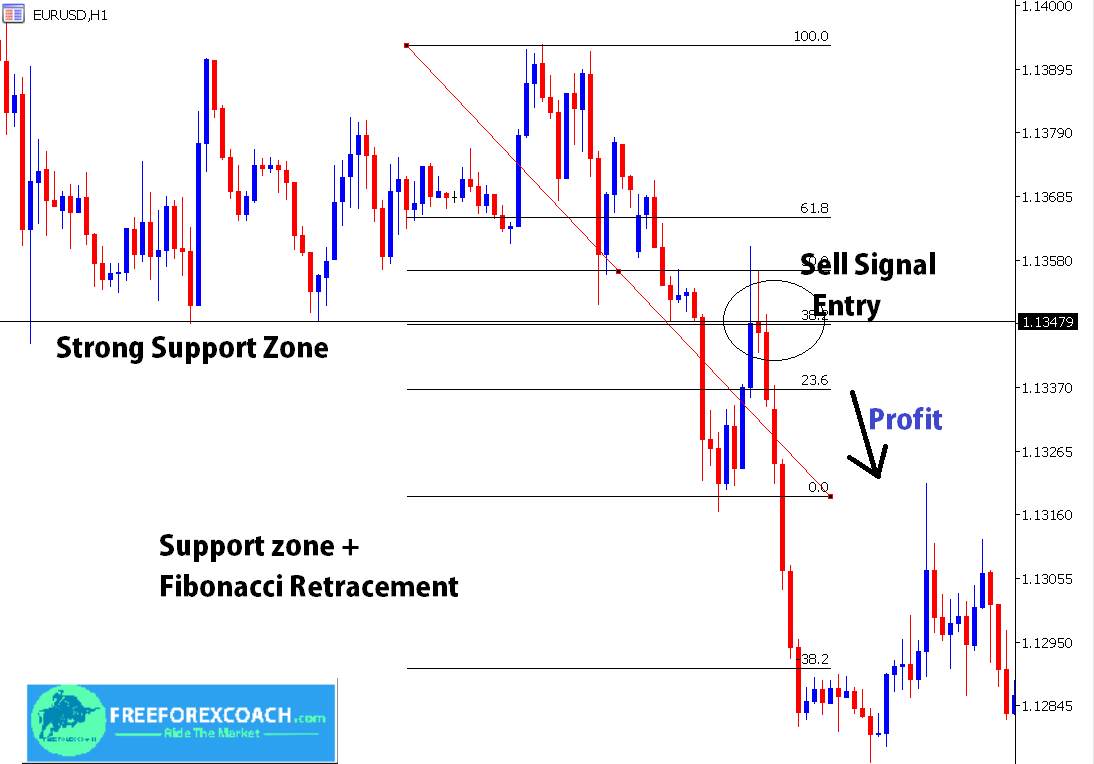
price came back and retested the support zone.
Same support zone with the Fib level intersection
Confirmation candle is the bearish candle on this zone.
Stop is set just on the next fibonacci level.
BUY SETUP – Combine Fibonacci retracement with Support and Resistance.
The guidelines are same as above;
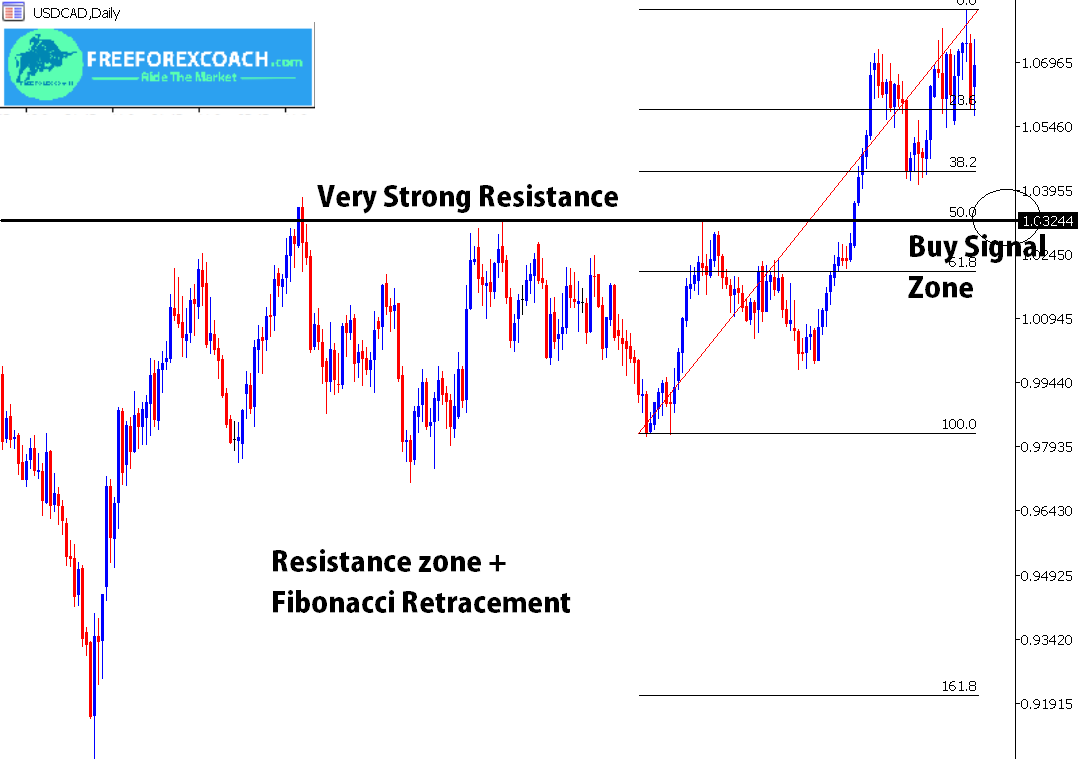
Identify strong resistance zone.With support and resistance,
Price break outs and Fibonacci retracement drawn on the break out swing.
In this case the 50.0% level coincides with the support zone.
Wait for price to come back to the intersection zone.
Looking at the chart below;
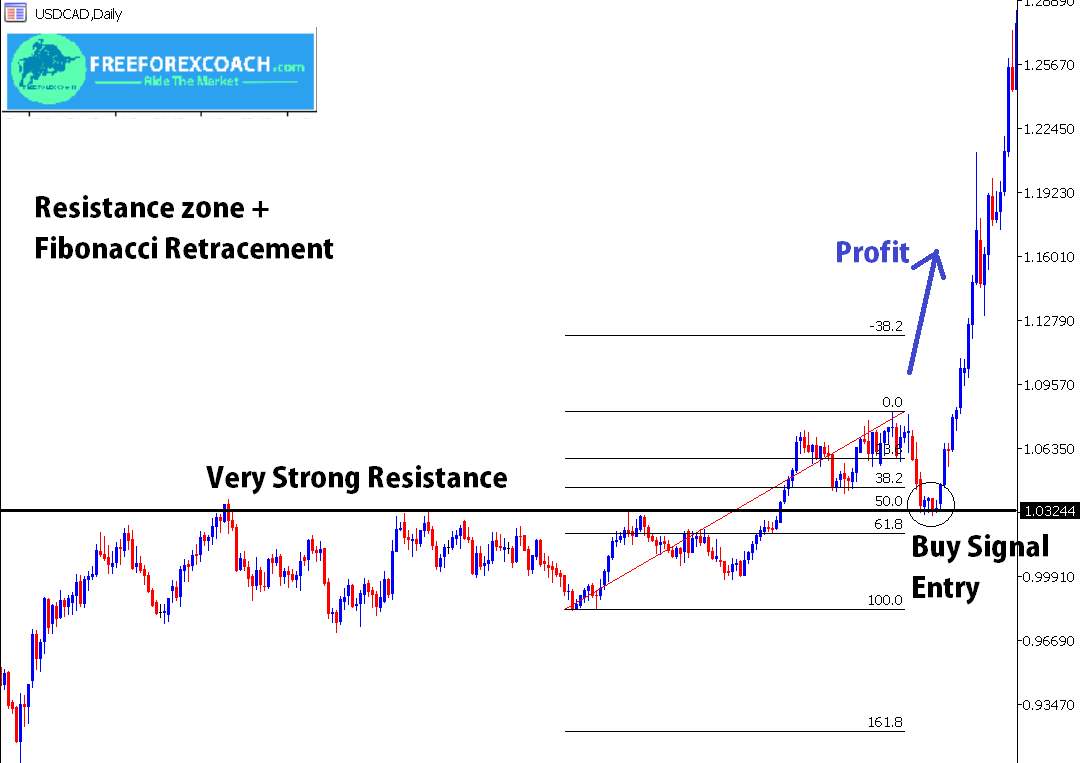
price came back and retested the resistance zone.
Same resistance zone with the Fib level intersection
Confirmation candle is the bullish candle on this zone.
Stop is set just on the next fibonacci level.
Conclusion
When trading Fibonacci retracement, remember we trade reversals on fib levels in the direction of the main trend.
If you trade on a good side there is a high chance of making good money where support and resistance aligns with the fib level.
The main important thing here is to take signals (buy/sell) on zones where Fibonacci and supports or resistance levels coincide.
The fact that Fibonacci retracement levels and support and resistance levels are price areas that most trader commonly watch, then the chance of prices bouncing from these levels are very high.
Therefore if you combine the two analysis tools, the signals you get are more reliable and are of a high grail.
From the charts above, the buy and sell signals are at levels of coincidence. These are the strongest levels of a reversal or bounce hence increasing more odds of making the right trade thus making profits.

How procrastination can affect your trading success?
Procrastination to trade is when your trading set up confirms and you hesitate to take trade. Or your trade show all failing signals and you hesitate to close trade to cut losses. Also, in cases, where you sometimes hesitate to take profit because you want to...
- Oh, bother! No topics were found here.

