
Let us learn how to combine Fibonacci Retracement with Trendlines to improve your Profitability. In the previous lesson, we learned how candlestick patterns give extra confirmations while trading the Fibonacci retracements.
Now we shall look at how Fibonacci retracements can be traded using the trendlines. First let’s take a small recap at the two terms.
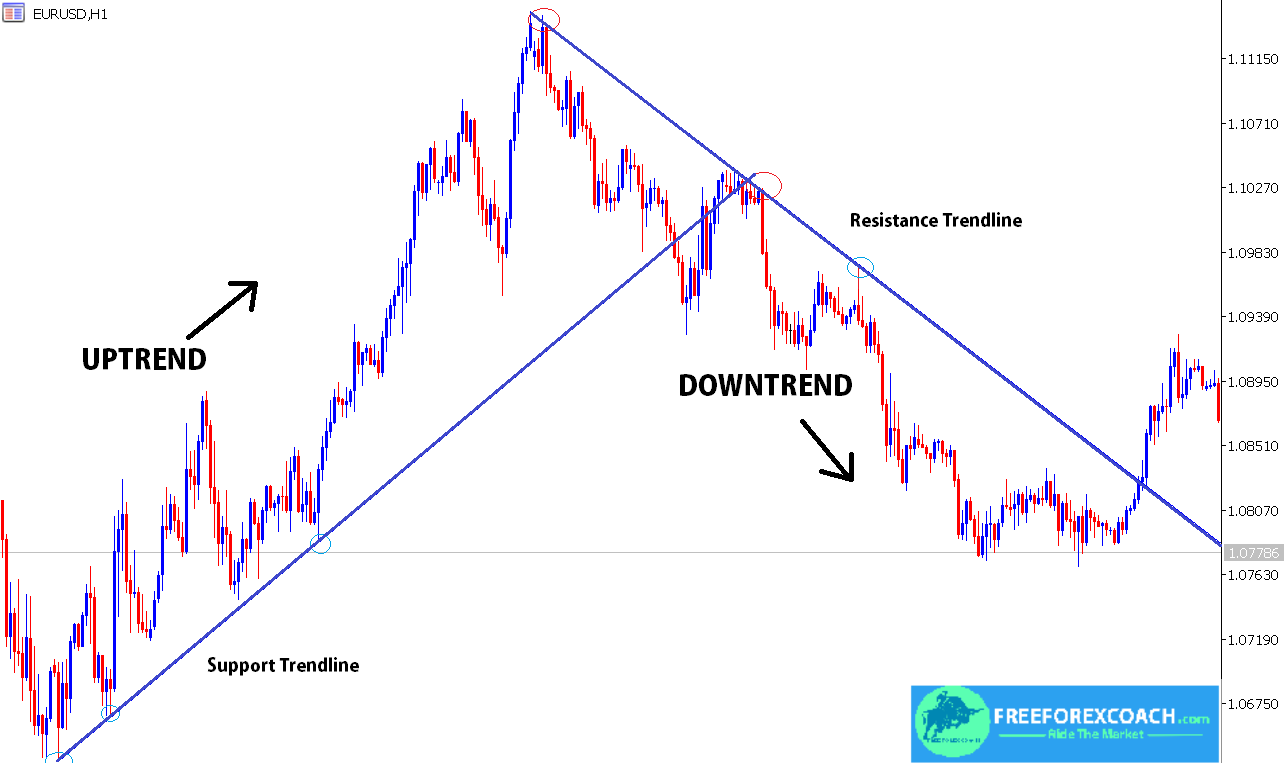
A Trend line is a technical analysis tool used to identify the trend direction. That is the Uptrend and the downtrend.
A Fibonacci retracement is a technical analysis tool with retracement levels of 0%, 23.6%, 38.2%, 50%, 61.8%, 78.6% and 100%. The Fibonacci retracement levels behave the same way as support and resistance.
As discussed in the previous lessons,
Fibonacci retracement works better in a trending market environment.
Trendlines help to identify the trend direction.
So it makes sense that, combination of the two tools can produce trades with the highest probability of winning.
How to draw a trendline
On your market chart, pick a trend, draw a trend line that at least touches the three points on the lows or highs.
- On the top left side above on the chart, you will see a slanting small line(/), trendline .
- Pick the tool with the mouse cursor, click, hold and drag to your chart.
- For an uptrend, ( support trendline) connect the line from the low of one wave to the next higher low.
- Extend the line out to the right to provide a projection of where the next lows could possibly occur.
- For a downtrend, (resistance trendline) connect the high of one price wave to the lower high of the next price wave and then extend it out to the right. The line provides a projection for where future wave highs may occur.
- The line should go through at least 2 -3 points of the higher lows/lower highs for an uptrend and the downtrend .
Also pick a previous swing on the same trend and draw Fibonacci retracement.
How to draw a fibonacci retracement on the chart
On the top left side above on the chart, you will see a small dotted lines with an (F) below ![]() . Simply click on it and move your cursor towards your chart. Don’t drag it. Just move it.
. Simply click on it and move your cursor towards your chart. Don’t drag it. Just move it.
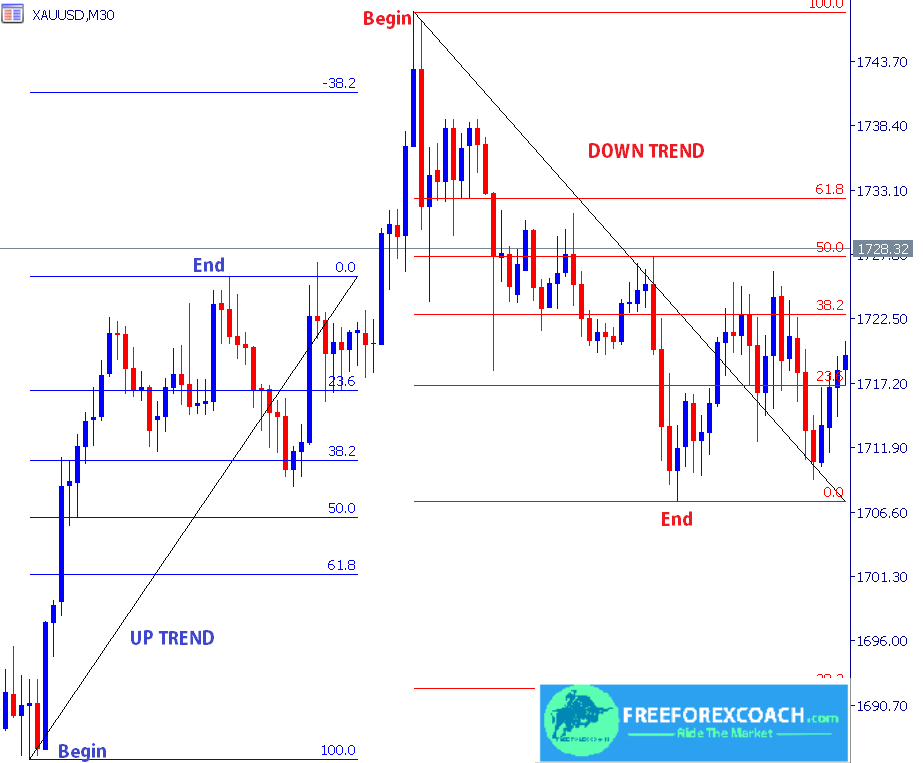
- For an uptrend, pick a lower low (begin), place the Fibonacci icon, click, hold and drag upwards to connect to the higher swing (end).
- Then release the cursor/left click of the mouse.
- For a downtrend, pick a higher high (begin), place the Fibonacci icon, click, hold and drag downwards to connect to the lower low swing (end).
- Then release the cursor/left click of the mouse.
Fibonacci retracement levels will display on the chart.
Since these tools are mostly believed in by most traders, combining the two tools would make a big deal. Now let’s get to the real lesson.
How to trade fibonacci retracement with trendlines
After drawing the trendline and the Fibonacci retracement, identify any level of intersection between the trend line and fibs levels. This is how you combine fibonacci retracement with trendlines
We shall look at a few examples below
General Rules on how to combine Fibonacci retracement with Trendlines
- The first thing you identify is the trendline. That means you have 2 points already.
- Draw the fibonacci retracement on the next swing wave.
- Watch for zones where the fib levels meet the trendline.
- Wait for confirmation as price hits this intersection.
- Confirmation is candle in the trend direction.
SELL SETUP – Combine FIb Retracement with Trendlines
Look at this chart;
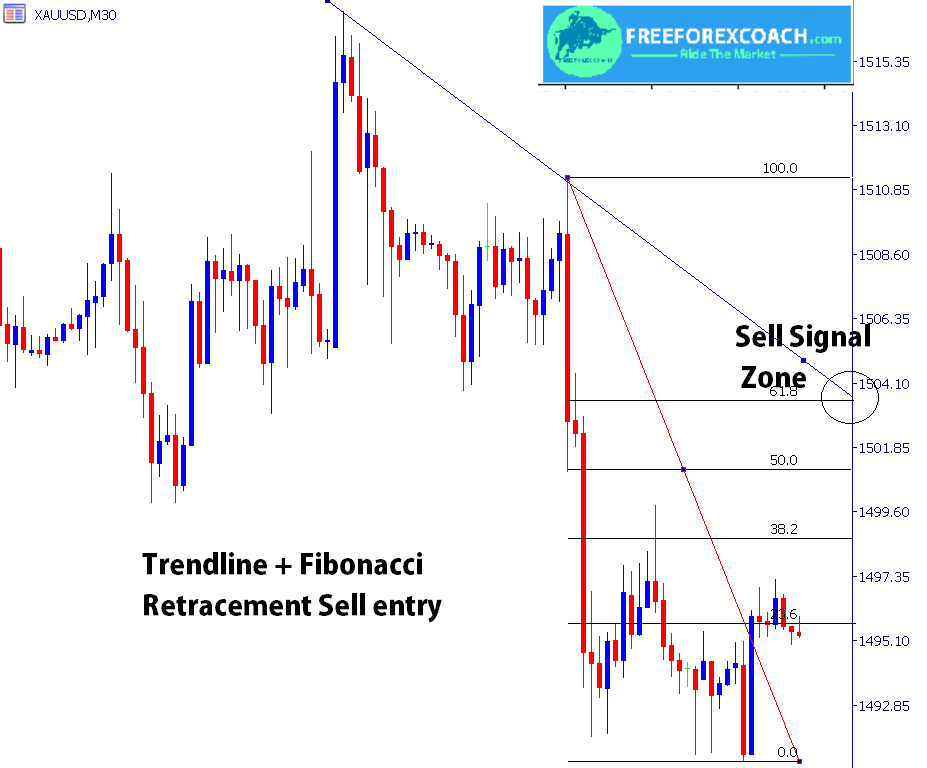
2 points picked and Resistance trendline drawn
Fibonacci retracement levels added on the new swing.
Trendline and Fib levels intersect at 61.8%
Wait for the reaction of price on the intersection level
After the long wait, price came back to retest trendline on same zone with the fib retracement level.
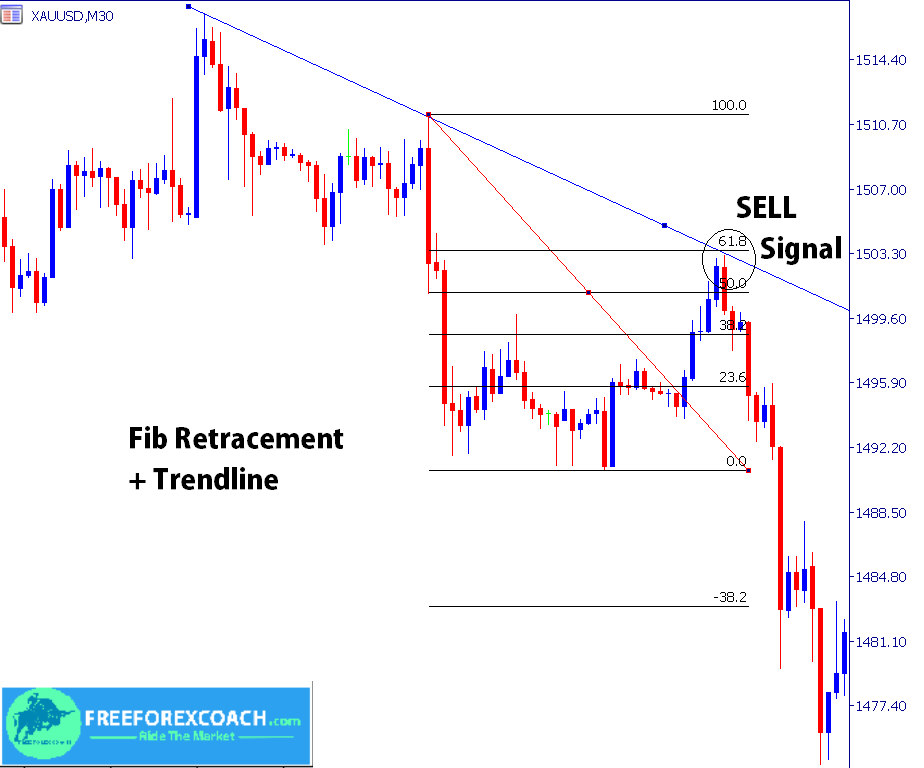
Confirmation for sell signal is the candle in trend direction. in this case, bearish candle.
How long you wait for confirmation depends on the timeframe with setup. An hour chart will obviously take shorter than a daily chart.
Stop loss can be set on the next fib level.
We shall discuss more on how to set targets with fib extension tool in later lessons.
BUy SETUP – How to combine Fibonacci Retracement with Trendlines
The procedure is same as above:
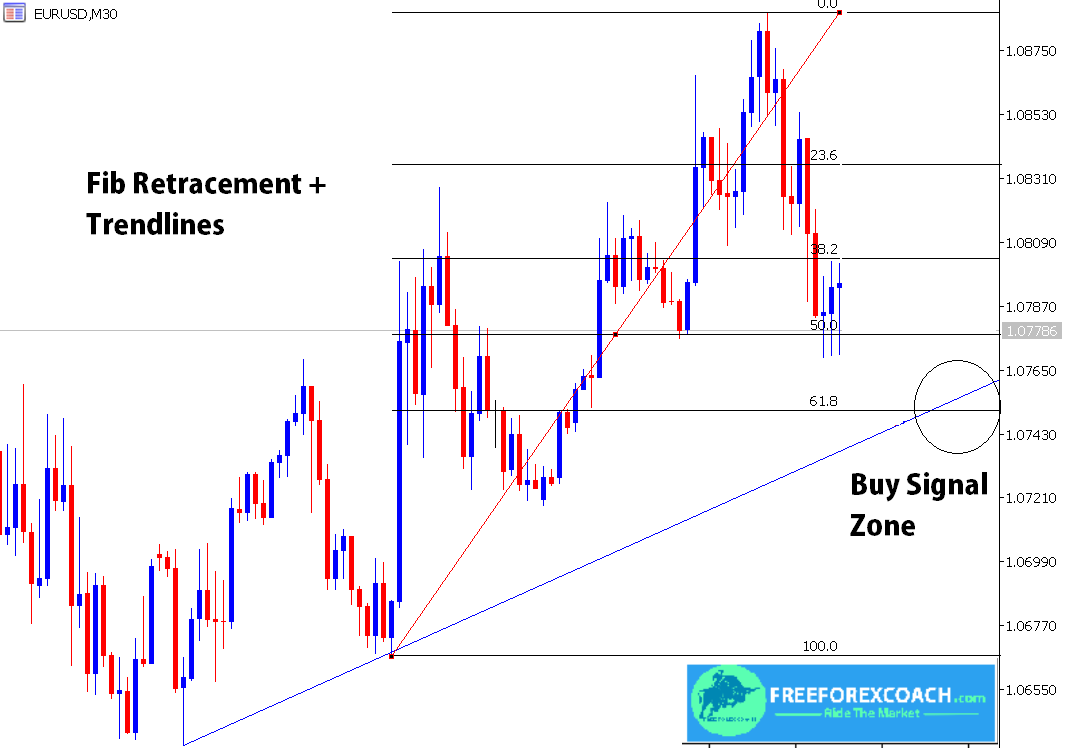
2 points picked and support trendline drawn
Fibonacci retracement levels added on the new swing.
Trendline and Fib levels intersect at 61.8%
Wait for the reaction of price on the intersection level
After the long wait, price came back to retest support trendline on same zone with the fib retracement level.
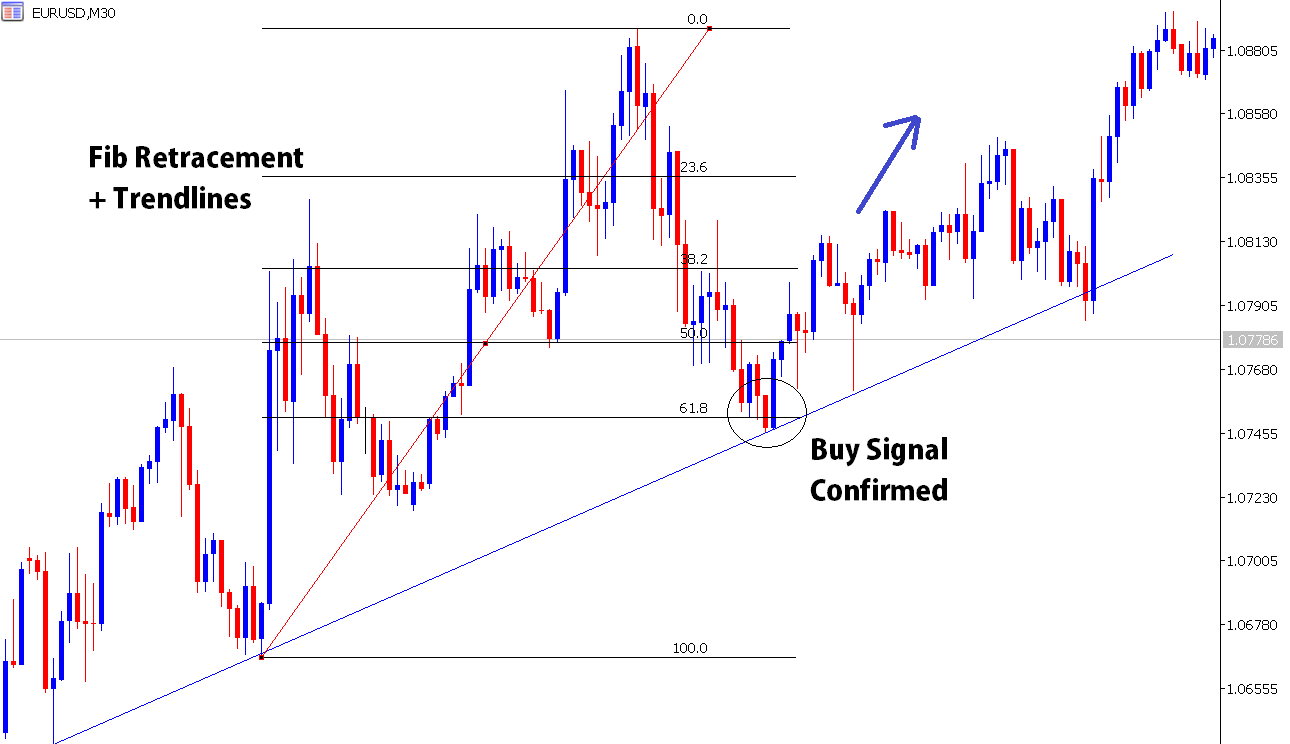
Confirmation for buy signal is the candle in trend direction. in this case, bullish candle.
Better confirmations are if the confirmatory candlestick is a reversal pattern,
Stop loss can be set on the next fib level.
All in all, remember when trading Fibonacci retracement, we take bounces/reversals on retracement levels in the direction of the main trend.
Therefore, the intersection of the trendline and the Fibonacci level determines your sell and buy entry points.
In cases where price breaks the trend line, and keeps going, it becomes an invalid setup. You need to look elsewhere or wait for another opportunity in the market.

How Does Greed Impact your Forex Trading Success?
There are several ways greed can impact your Forex trading success. Firstly, greed can make you abandon your well crafted trading strategy in favor of impulsive and speculative actions. Instead of adhering to predetermined entry and exit points based on technical or...
-
- Topic
- Voices
- Last Post
-
-
Trading preparation routine!
Started by:
in: Trading Discussions
- 1
- 4 years, 8 months ago
-
Consistency in Trading
Started by:
in: Trading Discussions
- 2
- 5 years, 3 months ago
-
Consistency and Trading Discipline
Started by:
in: Community
- 1
- 5 years, 3 months ago
-
choosing a broker to deal with for forex trading
Started by:
in: Broker
- 4
- 5 years, 4 months ago
-
Strategies for Profiting on Every Trade – Oliver Velez
Started by:
- 1
- 5 years, 5 months ago
-
Setting Stop Loss and Take Profit Levels.
Started by:
- 4
- 5 years, 5 months ago
-
cutting losses
Started by:
- 3
- 5 years, 5 months ago
-
Trading a real account
Started by:
in: Beginner’s Questions
- 6
- 5 years, 7 months ago
-
How to determine forex quotes
Started by:
in: Beginner’s Questions
- 3
- 5 years, 7 months ago
-
Forex trading
Started by:
- 4
- 5 years, 7 months ago
-
What is forex trading
Started by:
- 4
- 5 years, 9 months ago
-
What are the best indicators of trend direction?
Started by:
in: Trading Discussions
- 2
- 5 years, 9 months ago
-
Good time to trade
Started by:
- 4
- 5 years, 11 months ago
-
Forex trading
Started by:
- 3
- 5 years, 11 months ago
-
Forex Trading
Started by:
- 1
- 5 years, 11 months ago
-
Forex Trading.
Started by:
- 2
- 6 years ago
-
Forex Brokers That Offer Crypto currencies
Started by:
- 2
- 6 years, 2 months ago
-
Ernst & Young's Financial Planning Essentials
Started by:
- 1
- 6 years, 3 months ago
-
Trading preparation routine!

