
ABCD Harmonic Pattern in Forex is the simplest and the easiest to spot on the chart among the other harmonic patterns. It is commonly referred to as AB=CD by most traders due to its formation.
AB = CD simply means that move from A to B is equal to move from C to D .
It is actually better if time taken by the pattern to form A to B is the same time taken to form C to D.
AbCD Harmonic pattern in forex
A-B-C-D forms both in uptrend and downtrend which brings us to bullish harmonic and bearish harmonic pattern of A-B-C-D.
Also Lines AB and CD are called legs and BC is the correction/ retracement.
Let’s see how that looks like on the illustration below;
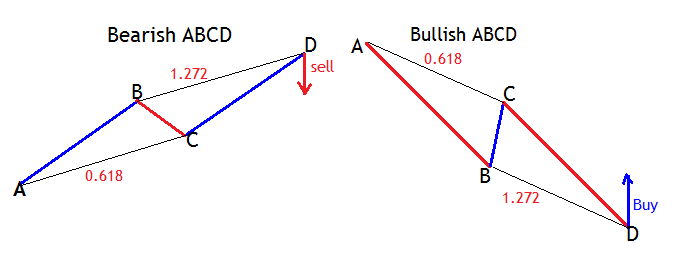
Using the Fibonacci retracement tool, the correction BC should form as far as 61.8% of AB and CD 127.2% extension from BC.
The time taken for price to move from A to B should be equal to time taken by price to form from C to D.
Buy or sell signal is after the completion of the pattern at D.
Let’s take a look on some examples and see how A-B-C-D harmonic pattern looks like.
The Bullish harmonic A-B-C-D pattern
The bullish harmonic pattern specifications;
- AB=CD
- BC retraces 61.8% of AB
- CD is 127.2% extension of BC
- Equal time of duration for AB and CD
Trade Rules
- Buy signal is after the completion of the pattern at D.
- Minimum target profit is at B
- Stop loss slightly below D
Example on Bullish ABCD Harmonic Pattern in Forex
Below is CAD/CHF, 4-Hour price chart with the pattern. The green lines represent Fibonacci retracement levels and the broken red lines represent extension levels.
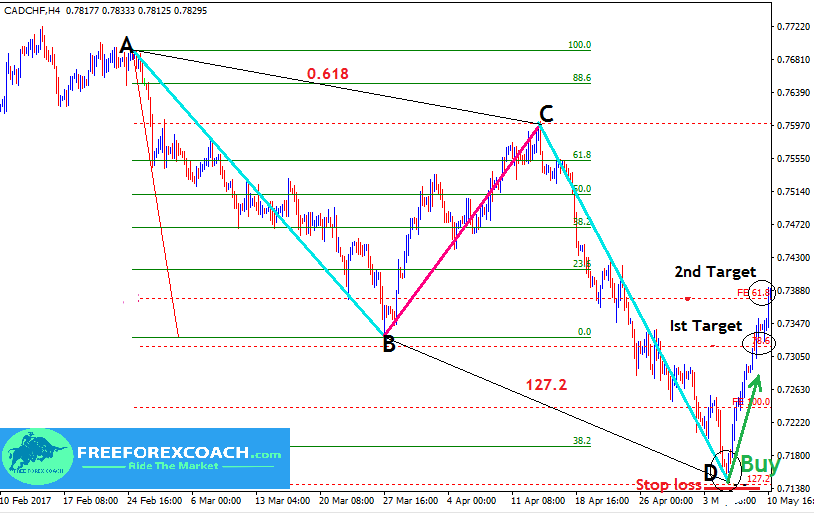
From our chart above,
The Buy signal zone is at D. We put Stop loss just below the entry trigger candlesticks.
The first profit target is at 78.6% extension level and second profit target is at 61.8% Fibonacci extension level as indicated above.
The Bearish ABCD harmonic pattern
Bearish ABCD harmonic pattern in forex has the same specifications as the bullish harmonic pattern. The major difference here is that bearish harmonic triggers sell signals.
The bearish harmonic pattern specifications;
- AB=CD
- BC retraces 61.8% of AB
- CD is 127.2% extension of BC
- Equal time of duration for AB and CD
-
Trade Rules
- Sell signal is after the completion of the pattern at D.
- Minimum target profit is at B
- Stop loss slightly above D
Example on Bearish ABCD Harmonic Pattern in Forex
The green lines represent Fibonacci retracement levels and the broken red lines represent extension levels.
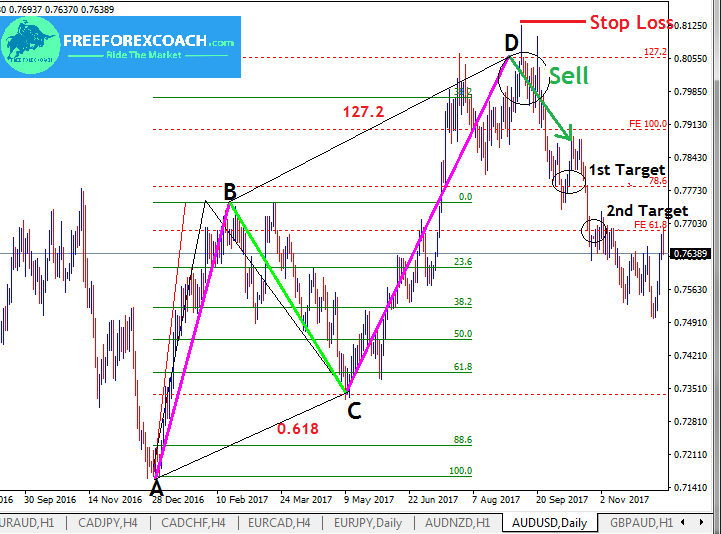
From our chart above,
The Sell signal zone is at D. We set Stop loss just above the entry trigger candlesticks.
The first profit target is at 78.6% extension level and second profit target is at 61.8% Fibonacci extension level as indicated above.

How procrastination can affect your trading success?
Procrastination to trade is when your trading set up confirms and you hesitate to take trade. Or your trade show all failing signals and you hesitate to close trade to cut losses. Also, in cases, where you sometimes hesitate to take profit because you want to...
- Oh, bother! No topics were found here.

