
Animal Patterns in Forex include; Butterfly pattern, Crab pattern and Bat pattern. Here are the rules on how to identify these animal patterns in forex.
1. The Butterfly animal patterns in forex
The butterfly starts with uptrend or downtrend which comes to exhaustion and draws zigzag like corrective movements.
It is a trend reversal pattern and comprises of four legs.
The butterfly is similar to the Gartley pattern but has 78.6% as XB
When it appears after a long price trend movement, it signals that the current price move is actually approaching its end. Therefore you need to prepare for a price reversal.
Like the Gartley pattern, the Butterfly pattern has four price swings, and resembles the letter “M” (in in downtrends ) and “W” (in uptrend).
There are 2 types;
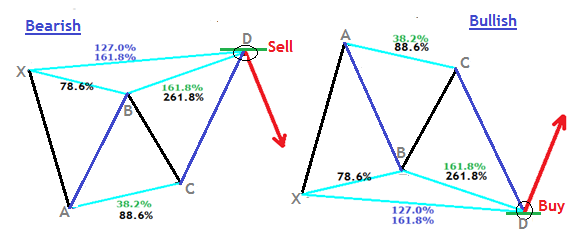
- The bullish butterfly “M” in a downtrend
- Bearish Butterfly “W” in an uptrend.
Let’s take a look at an illustration below;
Typical features of Butterfly pattern
The Butterfly pattern has four price swings.
- It takes a shape of the letter “M” (in in downtrends ) and “W” (in uptrend).
- Move AB should be 78.6% retracement of move XA.
- Move BC can either be 38.2% or 88.6% retracement of AB.
- If BC is 88.6% of AB, CD should extend 161.8% .
- If BC moves 38.2% of AB, then CD should extend 127.2% of BC.
- CD should be 127.2% or 161.8% retracement of XA.
How to trade a butterfly on a price chart
Take a look at the chart below with a bearish butterfly with its typical features as we mentioned above
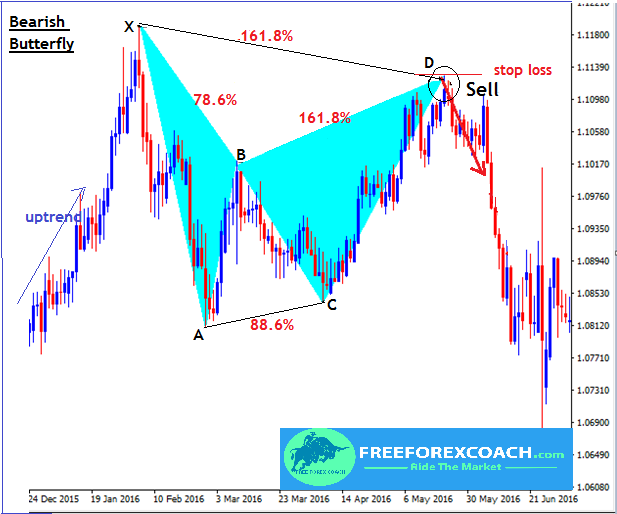
When this animal pattern completes at point D, at the 127.2% or 161.8% retracement of the X-A leg. Sell.
- Sell trigger entry is at D.
- The stop loss is placed few pips above point D.
- The safe target lies within 38.2 – 61.8% of AD move.
The most important point to ensure is to have a favorable risk reward ratio.
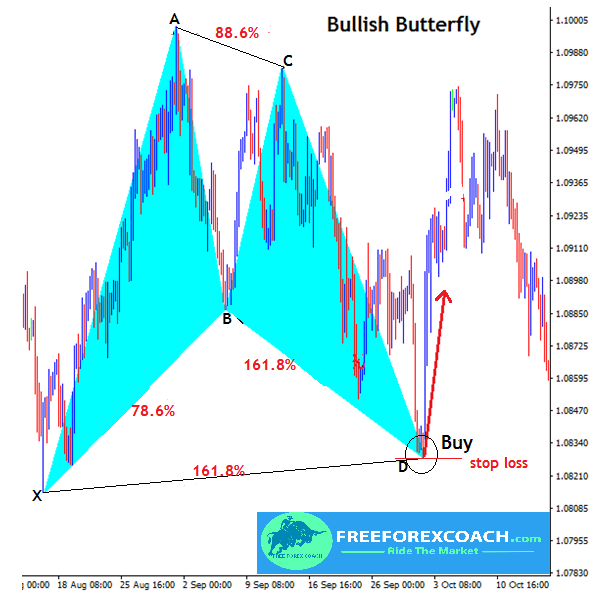
Now, let’s take look at the Bullish Butterfly pattern;
Take a look at the price chart below;
From our example above,
The Buy entry signal is at D.
This is where the pattern completes its formation, at the 127.2% or 161.8% retracement of the X-A leg.
The stop loss is placed few pips below point D.
The safe target lies within 38.2 – 61.8% of AD move.
You can also draw a new Fibonacci retracement from point A to D of the completed pattern. Then place your profit target at the 61.8% retracement level of A-D.
The most important point to ensure is to have a favorable risk reward ratio.
2. The Crab pattern.
The Crab has the best risk/reward ratio among all of the Harmonic Patterns. Just like the butterfly pattern, it is also a trend reversal pattern.
The Crab pattern and the Butterfly pattern are similar.
Like any other harmonic pattern, the Crab has a bullish and a bearish version of the Crab.
It was developed by Scot Carney and was named so because the bullish version of it looks like walking crab.
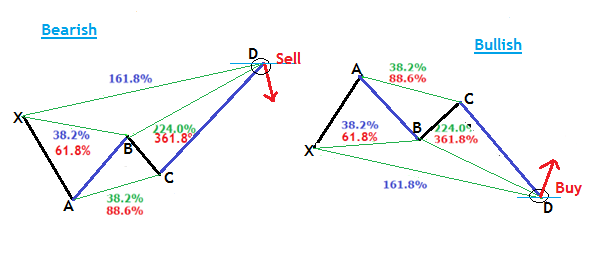
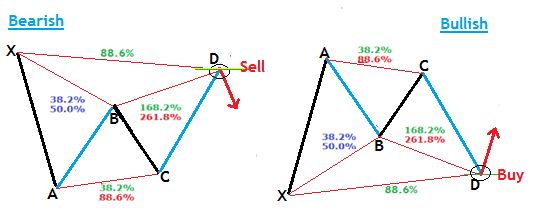
The structure of a Crab, check below
Rules for Crab Animal Pattern in Forex
- Move AB should be 38.2% or 61.8% retracement of XA.
- Move BC should be 38.2% or 88.6% retracement of AB.
- If the retracement BC is 38.2%, then the CD must move 224% of BC.
- If BC is 88.6%, then the CD should be 361.8% of BC.
- Move CD should be 161.8% retracement of XA
How to trade a Crab pattern on a price chart
Let’s start with an example below with a Bearish Crab pattern
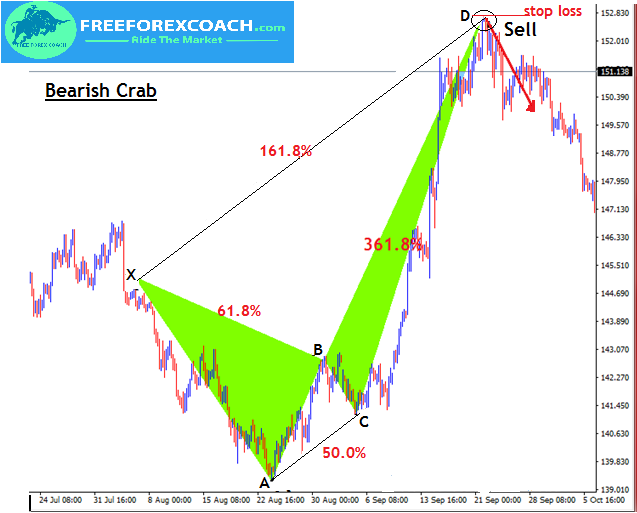
From our example above,
Sell trigger entry is at D.
Place your stop loss few pips above the farthest possible D level.
The safe target lies within 38.2-61.8% of AD move.
You can also draw a new Fibonacci retracement from point A to D of the completed pattern. Then place your profit target at the 61.8% retracement level of A-D.
The Bullish Crab pattern
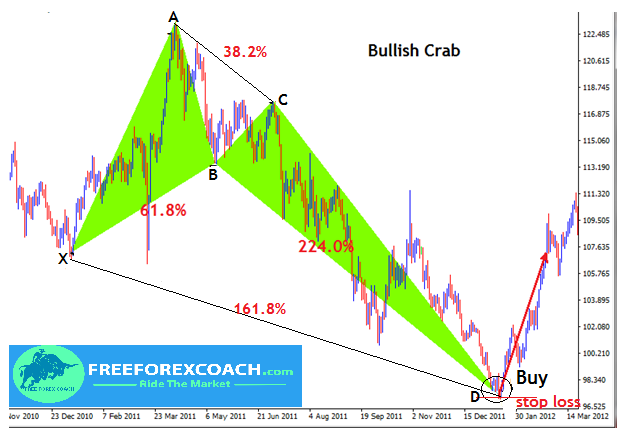
From our example above,
The Buy entry signal is at D.
Your stop loss should be few pips below the farthest possible D level.
And the profit target lies within 38.2-61.8% of AD move.
3. The Bat pattern
The bat pattern is a trend continuation pattern. It was also developed by Scot Carney. He named it so because it resembles the bat wings.
The Bat occurs more frequently than most of the other harmonic patterns. It also has a good risk reward ratio which makes the trader’s favorite pattern.
Like the Crab and the Butterfly,it also takes the shape of the Gartley Pattern.
Here we have a bullish bat pattern and a bearish bat pattern.
Take a look at the illustration below;
Rules for Crab Animal Pattern in Forex
- Move AB should be 38.2% or 50.0% retracement of XA.
- Move BC should be 38.2% or 88.6% retracement of an AB.
- If the retracement BC is 38.2% of AB, then the CD must move 161.8% of BC.
- If BC is 88.6%, then the CD should be 261.8% extension of BC.
- CD should be 88.6% retracement of XA
How to trade a Bat pattern on a market price chart
Let’s start with the example below with a Bearish Bat pattern.
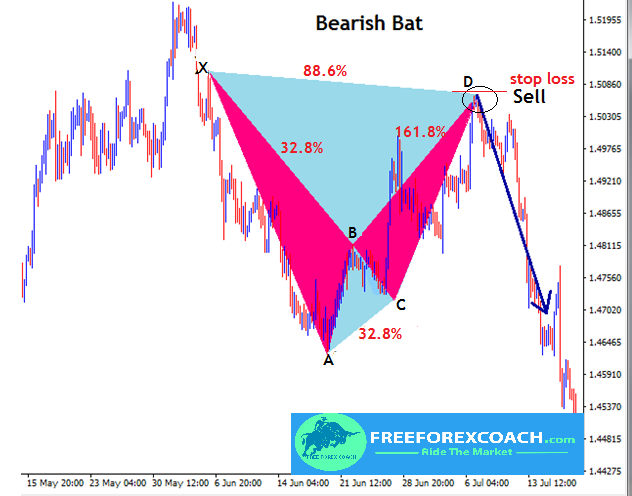
From our example above,
Sell trigger entry is at D.
Then place your stop loss few pips above the farthest possible D point.
Also set your profit target within 38.2-61.8% of AD move.
The Bullish Bat.
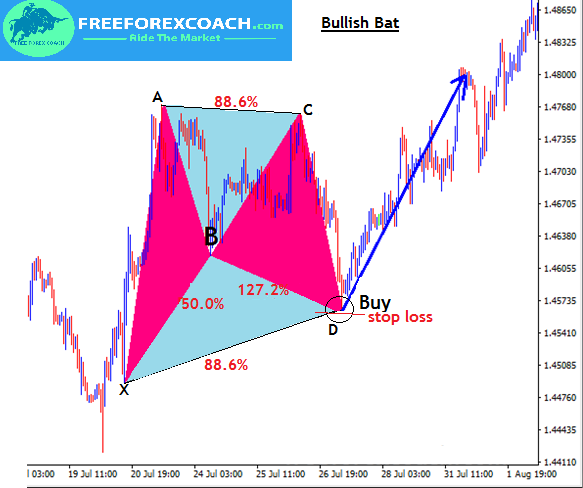
From our example above,
The Buy entry signal is at D.
Stop loss is few pips below the farthest possible D level.
Then profit target between 38.2 – 61.8% of AD move.
The most important point to ensure is to have a favorable risk reward ratio.

How procrastination can affect your trading success?
Procrastination to trade is when your trading set up confirms and you hesitate to take trade. Or your trade show all failing signals and you hesitate to close trade to cut losses. Also, in cases, where you sometimes hesitate to take profit because you want to...
- Oh, bother! No topics were found here.

