
Ascending Triangle Pattern in Forex is a right-angled triangle-shaped patterns.
It normally appears in an uptrend indicating a small pause in price movement by laying a congestion.
An ascending triangle is therefore a bullish continuation pattern.
What is an ascending triangle pattern in forex
Formation and Psychology of the Pattern
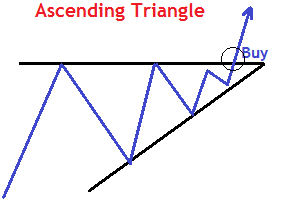
The ascending triangle pattern in forex is a bullish continuation pattern.
It has a flat resistance above and an ascending/rising trend line below. This is because, price action makes higher lows as it maintains the highs. Hence indicates more bullish bias than bearish.
The pattern completes when price breaks out of the triangle in the direction of the overall trend.
The break and close of the candle above the resistance line gives a confirmation. Buy signal for a continuation in the uptrend.
Example below
How to trade the pattern
Guidelines to trade ascending Triangle Pattern in Forex
- First, Since it’s a bullish continuation pattern, look out for an Uptrend.
- Spot the Pattern. Use the trend lines to draw the pattern.
- Wait for a confirmation candle to break and close above the upper side of the pattern.
- Then, take a buy position immediately on the close of the breaking candlestick above the resistance line.
The target is the same as the height of the triangle.
The stop-loss is set below the immediate lower level of the pattern.
Examples on How to Trade the Pattern
Example 1 : GBPCHF,M30 Chart
In the chart above,
you can see how the buyers kept in position making higher lows. After the breakout, price fell shortly and later rallied higher covering the same height as the triangle.
Meanwhile, our stop loss is set below lower low after entry.
For the profit target, simply measure the height of the ascending triangle formation and add that measurement to the breakout level.
Example 2: EURNZD, Hourly chart;
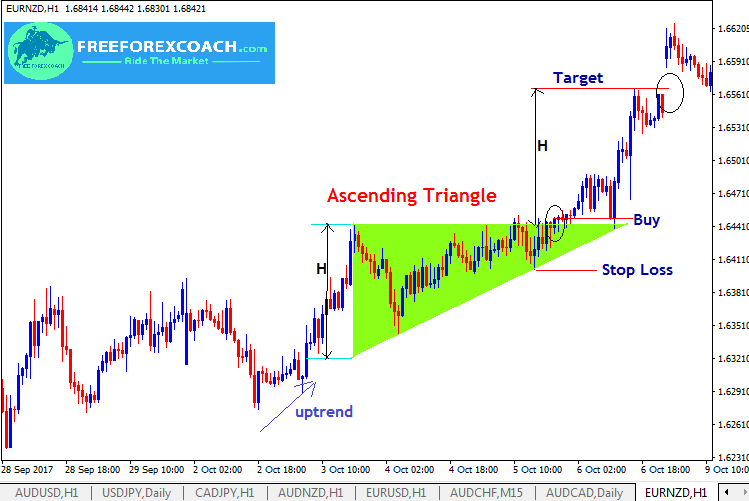
The EURNZD, Hourly chart above shows an ascending triangle in an uptrend.
From the above chart,
The signal confirmation is at price break on the flat resistance as identified with a black circle.
The Profit target is the same height as that of the pattern (H).
Therefore project that same distance (H) upwards from the resistance as shown in the chart above. Stop loss is set slightly below the immediate lower level of the pattern.
However, not all the time will price breakout the resistance. You will also see a downside breakout on the rising trendline of the pattern.
This simply means, you can also trade the pattern on the opposite direction.
IN SUMMARY
- The ascending triangle has a flat resistance level with a down side rising level as the price makes higher lows
- It is a bullish chart pattern that usually forms during an uptrend as a continuation pattern
- However, the ascending triangle pattern will sometimes form as a reversal pattern at the bottom of a downtrend. Hence bullish reversal pattern.
- The break and close of the candle above the resistance line gives a confirmation buy signal for a continuation uptrend.
- The profit target is the same distance as the height of the triangle.
Lastly, not all the time will price breakout the resistance level.
It can also breakout in the opposite direction on the rising trend line.

How Does Greed Impact your Forex Trading Success?
There are several ways greed can impact your Forex trading success. Firstly, greed can make you abandon your well crafted trading strategy in favor of impulsive and speculative actions. Instead of adhering to predetermined entry and exit points based on technical or...
-
- Topic
- Voices
- Last Post
-
-
Trading preparation routine!
Started by:
in: Trading Discussions
- 1
- 4 years, 8 months ago
-
Consistency in Trading
Started by:
in: Trading Discussions
- 2
- 5 years, 2 months ago
-
Consistency and Trading Discipline
Started by:
in: Community
- 1
- 5 years, 3 months ago
-
choosing a broker to deal with for forex trading
Started by:
in: Broker
- 4
- 5 years, 4 months ago
-
Strategies for Profiting on Every Trade – Oliver Velez
Started by:
- 1
- 5 years, 5 months ago
-
Setting Stop Loss and Take Profit Levels.
Started by:
- 4
- 5 years, 5 months ago
-
cutting losses
Started by:
- 3
- 5 years, 5 months ago
-
Trading a real account
Started by:
in: Beginner’s Questions
- 6
- 5 years, 7 months ago
-
How to determine forex quotes
Started by:
in: Beginner’s Questions
- 3
- 5 years, 7 months ago
-
Forex trading
Started by:
- 4
- 5 years, 7 months ago
-
What is forex trading
Started by:
- 4
- 5 years, 9 months ago
-
What are the best indicators of trend direction?
Started by:
in: Trading Discussions
- 2
- 5 years, 9 months ago
-
Good time to trade
Started by:
- 4
- 5 years, 11 months ago
-
Forex trading
Started by:
- 3
- 5 years, 11 months ago
-
Forex Trading
Started by:
- 1
- 5 years, 11 months ago
-
Forex Trading.
Started by:
- 2
- 6 years ago
-
Forex Brokers That Offer Crypto currencies
Started by:
- 2
- 6 years, 2 months ago
-
Ernst & Young's Financial Planning Essentials
Started by:
- 1
- 6 years, 2 months ago
-
Trading preparation routine!

