
Bullish Rectangle Pattern in Forex is a bullish continuation pattern. It forms in an uptrend defining the horizontal levels of support and resistance.
This indicates equal strength between the buyers and sellers in the market. It is possible that price will continue in its initial trend direction after the completion of the pause.
What is a bullish rectangle pattern in forex
The bullish rectangle pattern forms in an uptrend defining the horizontal levels of support and resistance.
Price bounces up and down between the horizontal support and resistance line. It maintains its highs and lows forming trading range inform of a rectangle.
Take a look at the illustration below;
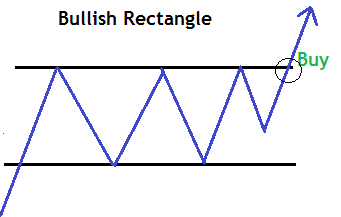
A bullish rectangle pattern is normally seen after a sharp rally of prices in uptrend.
Formation of a Bullish rectangle Pattern on Forex chart
In the example above,
We can clearly see that the price stayed between the two key price levels which are parallel to one another.
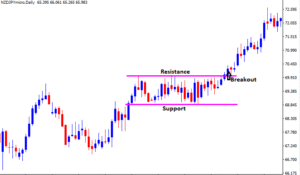
A breakout on the resistance line signals a probable continuation of the trend after consolidation
When trading rectangles, it is possible that price can breakout on either sides.
It is therefore very important to always wait for the breakout as a confirmation of the pattern before taking any trade.
This simply means that price can still break the bullish rectangle support hence trend reversal.
How to trade the pattern
When trading a bullish rectangle pattern in Forex , its important to always wait for a breakout confirmation on the resistance level.
Guidelines on how to trade the Bullish Rectangle Pattern
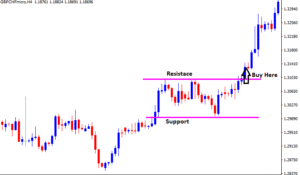
- There must be a strong bullish trend .
- Spot formation of the pattern. Draw horizontal lines to identify the pattern
- Take a buy/ long position as soon as a bullish candlestick closes above the resistance level after the break.
Alternatively, you can take your trade position after a price retest on resistance after the breakout.
All in all,the confirmation entry signal comes after the close of the bullish candlestick after the breakout.
Now that we know how and when to take position on a bullish rectangle pattern, let’s see how to estimate target profit on trade.
Target profit and stop loss
Set your stop-loss slightly below your entry point below the next low.
To determine the target point, measure the distance between the support line and the resistance line i.e the height of the rectangle. Then project same distance upwards after the breakout from the resistance level.
Therefore, your target point from entry point should be equal to the distance between the resistance and support line of the rectangle.
Let’s take a look at the GBPCHF, H4 chart below;
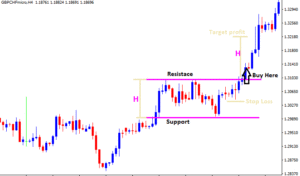
From the chart above,
The buy signal is at the break of the resistance.
Stop loss is set slightly below the next low below the resistance.
The target Profit is got by measuring the height of rectangle (H) and projecting that same distance (H) upwards as shown in the chart above.
In Summary
- The bullish rectangles are continuation patterns that occur when a price pauses temporarily during an uptrend.
- A breakout on resistance gives a confirmation signal for a buy entry position.
- However, price can breakout on either sides of the rectangle
- After entry, set your stop loss slightly below the next low below entry point
- Place your profit target the same distance above the rectangle’s upper resistance level as the distance between the rectangle’s two parallel lines.

How procrastination can affect your trading success?
Procrastination to trade is when your trading set up confirms and you hesitate to take trade. Or your trade show all failing signals and you hesitate to close trade to cut losses. Also, in cases, where you sometimes hesitate to take profit because you want to...
- Oh, bother! No topics were found here.

