
Inverse head and shoulders pattern in forex is the same as the Head and Shoulders, but inverted.
It occurs after a long extended downtrend.
The main difference is that the head and shoulders is a bearish reversal pattern whereas the inverse head and shoulders is a bullish reversal pattern.
The inverse head and shoulders pattern in forex
Formation & Psychology of Inverse head and shoulders Pattern in Forex
As price falls,
It reaches a certain level, bounces up forming the first shoulder. This is a pullback against the downtrend as traders try to wind up their positions.
Price hits the neckline, and then falls again but slightly lower than the first low. As of the fact, this signals that more sellers are still in the market.
Price bounces back up again strongly (head), tests the same level as the first high. This is as a result of buyers who come in to take advantage of low prices hence pushing prices back up.
As price hits the same resistance level, it falls back again . This time it holds on the same level or almost as the first shoulder .
At this point, there are some of the sellers who haven’t yet given up.
Price then bounces back strongly upwards for the last shoulder. The buying pressure is stronger than the selling pressure hence possible change in trend direction.
When you connect the highs of the left shoulder, the head and the right shoulder, you form a resistance zone or the neckline.
Confirmation on the pattern
BREAKOUT ON THE NECKLINE
The pattern is completed after the break and close of the blue candlestick above the neckline. This confirms the Buy signal
That is; when the price action on the right shoulder breaks the Neck Line with a bullish candlestick closing above the neckline.
You can also consider a price retest after the breakout for extra confirmation.
Then trade the pattern in the direction of the breakout which is the uptrend direction.
Always wait for the price break on the Neckline for entry signal confirmation to avoid false breaks.
How to trade the inverse head and shoulders
The inverse head and shoulders pattern in forex is a bullish reversal pattern therefore we look to it to generate buy entry signals.
It is valid when it forms in the downtrend.
Steps to Trade Inverse Head and Shoulders Pattern In Forex
- First identify a strong a downtrend.
- When you spot an inverse head and shoulders, draw a horizontal or trend line connecting the highs to form a neckline.
- Wait for the price Breakout on completion of the right shoulder on the neckline.
- Take trade/buy as the price breaks and closes above the Neck Line with a bullish candlestick.
If you still have a second thought, wait for a price retest after the price break on the neckline.
Take entry on the second breakout confirmation.
It’s always important to wait for the pattern to complete in order to avoid fakeouts.
Stop Loss and Take Profit Levels
For SL: Put your stop level slightly below the right shoulder in the pattern.
For Tp: Measure the size of the pattern(height) from the neckline to the head low and then apply the same distance to the upside starting from the Neck Line.
This would be your minimum target profit.
Examples on how to make entries
Example 1: AUDCHF, Daily chart below;
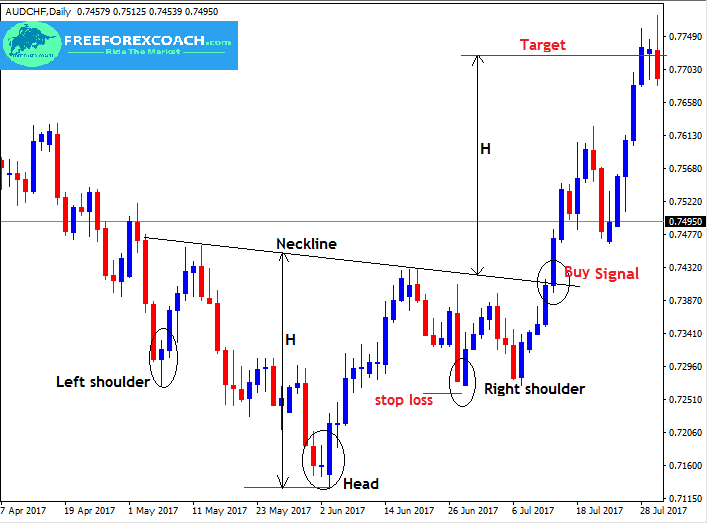
Like we said earlier the inverse head and shoulders is a reversal pattern that occurs after a downtrend and gives possible buying opportunities.
So from the chart above,
The confirmation for the Buy entry is the break and close of bullish candle above the Neckline. You can take a look.
Stop loss is set just below the right shoulder.
The profit target got by measuring vertical distance H from Head to Neckline and projecting that same distance H upwards as the profit Target as shown above.
Example 2: GOLD, 30 minute chart.
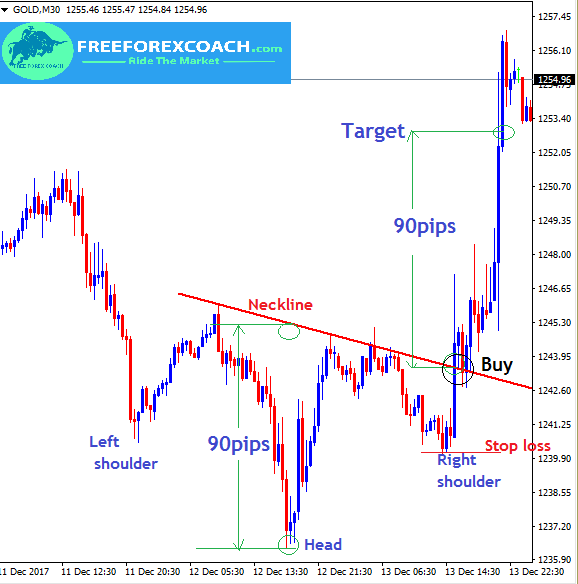
From the Gold chart above,
We have a buy signal confirmation at the break and close of bullish candle above the Neckline.
Stop loss is set just below the right shoulder as indicated on the chart.
Our target profit is got by measuring vertical distance (90 pips) from Head to Neckline and projecting that same distance (90 pips) upwards.
Conclusion
First,
Remember the inverse head and shoulders occurs after a long market extended down move.
Therefore it is a bullish reversal pattern.
The appearance of the inverse head and shoulders shows the exhaustion of sellers and a probable reversal of the trend putting the buyers at an advantage i.e Buy signals
Just in case you forgot,
A breakout of bullish candlestick pattern on the neckline gives confirmation for a complete patten and a buy signal.
Like the heads and shoulders, this pattern forms on all time frames but more strong when on a higher time frame.
When trading with this pattern, it is easy to measure your risk reward ratio.
To set stop loss, measure the distance between from the neckline below to the low of the right shoulder.
For take profit target, measure the size of the pattern(height) from the neckline to the head low and then apply the same distance to the upside starting from the Neck Line.

How procrastination can affect your trading success?
Procrastination to trade is when your trading set up confirms and you hesitate to take trade. Or your trade show all failing signals and you hesitate to close trade to cut losses. Also, in cases, where you sometimes hesitate to take profit because you want to...
- Oh, bother! No topics were found here.

