
Triple Bottom Pattern in forex is a strong bullish reversal pattern that normally forms after a long down trend. Its formation signals a probable bullish reversal in trend.
The triple bottom works like the double bottom.
The only difference is that it tests the support three times and breaks the resistance line on the complete of the third peak at the bottom
What is triple bottom pattern in forex
The triple bottom pattern in forex is a bullish reversal.
It forms three bottoms arranged almost at the same level.
The highs and lows can be joined with a line to mark support and resistance levels. The prior trend shows that sellers were in control of the market.
The formation of Triple bottoms after a long down trend signaling possible change in trend direction.
Triple Bottom Pattern Formation
The first bottom forms immediately after a strong downtrend move. Price then retraces to the neckline/resistance and then falls back attempting to break the support level but fails again.
When it pulls back up to the neckline again, it then forms a the second bottom.
On the next retracement, it tries the third attempt to break the support level but all in vain.
Price volume increases again as the pattern completes the formation.
The Triple bottom pattern in forex forms 3 consecutive lows of similar or almost the same height with 2 moderate pull backs in between (neckline).
The pattern is considered complete when price breaks the highs or resistance line.
As the price breaks the resistance line , we expect a change in the previous trend.
Confirmation of triple bottoms
The resistance level commonly referred to as the neckline acts as the trigger line for the confirmation.
Entry-level is in the direction of the reversal breakout.
BREAKOUT ON THE NECKLINE
The pattern is valid when the price action(third bottom) breaks the Neck Line with a bullish candlestick closing above the neckline.
However, you can also opt for an entry after a price retest after the breakout for extra confirmation.
Then trade the pattern in the direction of the breakout which is the uptrend direction.
When a bullish candlestick breaks and closes above the resistance line, the pattern has confirmed a Buy signal.
HOW TO TRADE TRIPLE BOTTOMS
Steps to trade Triple Bottom Pattern in Forex
- There must be strong downtrend prior to the pattern.
- Spot the triple bottoms pattern at the end of a downtrend, draw the Neck Line connecting the highs .
- Then wait for the Neckline Breakout on completion of the third bottom.
- Entry is close above the Neck Line with a bullish candlestick.
You can also wait for a price retest after the price breaks the neckline. Take entry on the second breakout confirmation. Buy/Long the pair.
Stop loss and Take Profit Levels
For SL,
Put your stop level slightly below the higher low/bottom of the three bottoms in the pattern.
If all are on the same level, put your stop level slightly below the bottoms or support level.
For TP
Measure the size of the pattern(height) from the neckline to the lowest bottom and then apply the same distance to the upside starting from the Neck Line.
This would be your minimum target profit.
Examples on How trade triple bottoms
Example 1: AUDJPY, Daily Chart

From the above example,
Buy signal was at break & close of the blue candlestick above the neckline.
The Stop loss just below the 3rd bottom.
The target was got by simply measuring the height of the pattern (H) and projecting that same distance from the neckline upwards.
If you can take a good look after the breakout, you will notice there was a slight price pullback to the downside. That does not make the pattern invalid since it didn’t close below the last bottom.
Actually if you are a Conservative trader,
the second breakout after a pull back would be the best time for you to take trade.
You can also decide to bring your stop loss closer to the lower low of the price pullback.
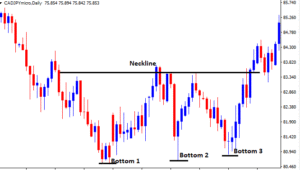
Example 2: CADJPY, Daily chart below

On the CADJPY, Daily chart above,
Buy signal was at break & close of the blue candle above the neckline.
The Stop loss just below the 3rd bottom .
The target was got by simply measuring the height of the pattern (H) and projecting that same distance from the neckline upwards.
In addition, always set stop loss depending on the expected market volatility after your entry.

How procrastination can affect your trading success?
Procrastination to trade is when your trading set up confirms and you hesitate to take trade. Or your trade show all failing signals and you hesitate to close trade to cut losses. Also, in cases, where you sometimes hesitate to take profit because you want to...
- Oh, bother! No topics were found here.

