
Major Chart Patterns to Learn in Forex are Continuation and Trend Reversal Patterns.
The Forex market is more of a battle field where both buyers and sellers battle to take lead in the market.
The winner leads the market, resulting to either an uptrend or downtrend. However, when there is equal strength in the market, you will see price move in sideways direction.
As a trader you need tools that will help you to gauge the strength of the buyers and sellers so as to identify the correct trend direction.
Chart patterns do it all for you.
If It’s your first time to trade/ learn about forex, chart pattern are part of technical analysis. You can add them to your trading strategy to identify trade signal set ups.
For the traders who have been around the Forex market for any length of time, you already know the chart patterns and their importance in technical analysis.
There are various types of chart patterns but we will take you through the most popular patterns that are easy to spot and common to most traders.
Chart patterns are in form of pictures or shapes or just formations on your trading chart.
I would recommend a candlesticks chart because it has clear formations
Let’s have a brief introduction, later we will discuss the details of each pattern with examples. We shall discuss each pattern in detail with examples in the next lessons.
Chart patterns are classified into 3 major groups;
- The reversal chart pattern
- Continuation chart pattern and
- Bilateral chart patterns.
The reversal chart patterns to learn
The trend reversal chart patterns appear at the end of a trend. These are some of the Major Chart Patterns to Learn in Forex.
They signal trend reversals.
The reversal chart patterns indicate that the current price movement is about to change direction.
For instance;
if a reversal chart pattern forms in an uptrend, it signals that the uptrend is coming to an end and a down trend is about to begin.
The same goes for a downtrend. When a reversal chart patterns appears at the bottom of a down trend it signals the upcoming of an uptrend.
The reversal normally occurs on completion of the pattern.
Some of the reversal patterns are:
- Head and shoulders chart pattern
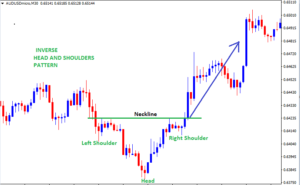
- Inverse head and shoulders
- Double tops and Double bottoms
- Triple tops and Triple bottoms
You can guess the trader’s favorite!
Head and shoulders or inverse head and shoulders.
The only difference is that;
The head and shoulders forms at the top of an uptrend. Therefore it is a bearish reversal pattern.
The inverted head and shoulders appears at the bottom of a downtrend. It is a bullish reversal pattern.
Chart showing Inverted Head & Shoulders Pattern
Continuation patterns
Continuation chart patterns are small pauses made by price before it continues in its initial direction.
This means that as price is moving, it reaches at a certain point pauses for sometime and then continues in the same direction.
These pauses in price movements are known as consolidations or congestion.
During price consolidation, there is a lot of indecision between the buyers and the sellers about the future direction of the market.
Therefore, traders to hold onto their currency or stocks until they get a clear picture of where the market is likely to head.
This may be due to several reasons like future expected fundamental economic news or change in the country’s government.
The continuation chart pattern appears when the price is trending or after a very strong price move.
In this case, continuation patterns indicate that a new move in the same direction is likely to occur after the pause.
There are lots of them in the market, so you can never fail to get what to trade.
The major continuation patterns include;
- Ascending triangles
- Descending triangles
- Symmetric triangles
- Bullish rectangles
- Bearish rectangles
- Flags
- Pennants
- Falling and rising wedges
- Cup and handle
- wedges
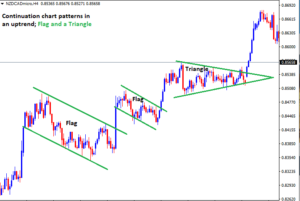
The most common are the triangles and the flags. You are likely to see the flags especially after a strong move following news release.
Chart showing Flags and Triangle as Continuation Patterns
Bilateral Chart Patterns
Bilateral patterns give two opposite signals.
The pattern shows that prices can either move up or down in either direction.
These are neutral patterns. This shows that any thing can happen at that point.
The bilateral patterns can either be reversal patterns or continuation chart pattern.
The best example for a bilateral pattern is rectangle pattern and triangle patterns.
If price breaks the upper line of a rectangle it is likely to take the upper direction and when it breaks the lower line that’s a possible down trend. It works either way.
Chart showing Rectangle bilateral Patterns
All in all, the technical chart patterns are the easiest to trade because;
- They are easy to spot.
- When trading them, it easy to set stops and target. To set targets, you just look at the size(height) of the pattern
- They also indicate whether the price will continue in its current direction or reverse.
- When price breaks a support or resistance of a reversal pattern, you expect a change in the direction of a trend soon. Whereas a price break on a continuation pattern in a trend signals a strong rally ahead.
As earlier said, We shall discuss the details of each pattern and how to trade each of them in the next lessons. We shall start with the Double tops!!

How Does Greed Impact your Forex Trading Success?
There are several ways greed can impact your Forex trading success. Firstly, greed can make you abandon your well crafted trading strategy in favor of impulsive and speculative actions. Instead of adhering to predetermined entry and exit points based on technical or...
-
- Topic
- Voices
- Last Post
-
-
Trading preparation routine!
Started by:
in: Trading Discussions
- 1
- 4 years, 8 months ago
-
Consistency in Trading
Started by:
in: Trading Discussions
- 2
- 5 years, 3 months ago
-
Consistency and Trading Discipline
Started by:
in: Community
- 1
- 5 years, 3 months ago
-
choosing a broker to deal with for forex trading
Started by:
in: Broker
- 4
- 5 years, 4 months ago
-
Strategies for Profiting on Every Trade – Oliver Velez
Started by:
- 1
- 5 years, 5 months ago
-
Setting Stop Loss and Take Profit Levels.
Started by:
- 4
- 5 years, 5 months ago
-
cutting losses
Started by:
- 3
- 5 years, 5 months ago
-
Trading a real account
Started by:
in: Beginner’s Questions
- 6
- 5 years, 7 months ago
-
How to determine forex quotes
Started by:
in: Beginner’s Questions
- 3
- 5 years, 7 months ago
-
Forex trading
Started by:
- 4
- 5 years, 7 months ago
-
What is forex trading
Started by:
- 4
- 5 years, 9 months ago
-
What are the best indicators of trend direction?
Started by:
in: Trading Discussions
- 2
- 5 years, 9 months ago
-
Good time to trade
Started by:
- 4
- 5 years, 11 months ago
-
Forex trading
Started by:
- 3
- 5 years, 11 months ago
-
Forex Trading
Started by:
- 1
- 5 years, 11 months ago
-
Forex Trading.
Started by:
- 2
- 6 years ago
-
Forex Brokers That Offer Crypto currencies
Started by:
- 2
- 6 years, 2 months ago
-
Ernst & Young's Financial Planning Essentials
Started by:
- 1
- 6 years, 3 months ago
-
Trading preparation routine!

