

Hello team, today I would love us to look at structure drawing & pattern identification on forex charts.
I hope you had a wonderful week last week and the weekend was relaxing. My last post focused on patterns and I hope it was very educative simply because this patterns occur very often and they tend to behave the same way.
We can catch so many trades if we realize how we can use this patterns to enter trades and set our trade targets.
All that said and done, today we shall look at how we draw the structures and identify the patterns. The patterns can be drawn even on 1 minute time frames but I always avoid the lowest time frames to single out noises in the markets.
It is also important that you all note that this patterns occur even in the stock markets therefore making wave trading applicable in every market.
We can single out any pair and do structure drawing & pattern identification. In our case we will pick the USDCHF.
When we are drawing structure, we always start with the biggest time frames and narrow it down to the least time frame (multi-time frame analysis) when we will be entering the trades.
We also use indicators at this point but I will try and avoid them in my today post.
Structure Drawing & Pattern Identification Procedure
Monthly Time frame
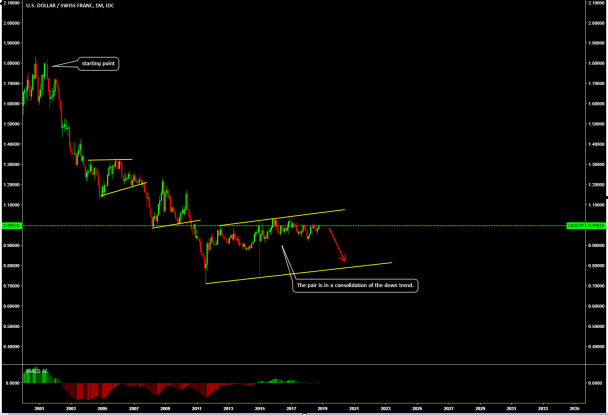
The pair is in a consolidation of the downtrend. It is also possible to identify continuation patterns in the pair.
I would also advise people to look at the indexes before looking at the pairs. A deep understanding on the pairs simplifies everything. All the currency indexes can be easily found and traced online.
Weekly Time Frame
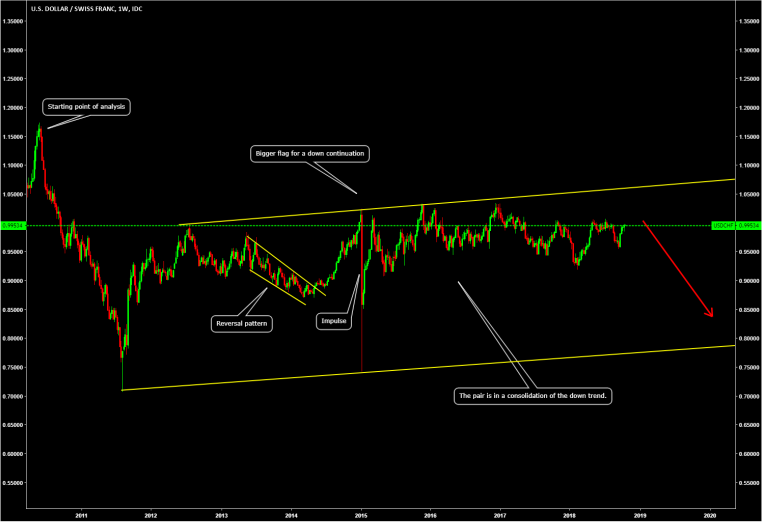
The weekly flag can now be easily seen. Remember we have now moved to the lower time frames.
You can also see other trade patterns in the chart.
The use of indicators can highly help you realize when the consolidation is about to end. This helps you avoid entering trades way too early. It is also important to keep your charts clean for better view.
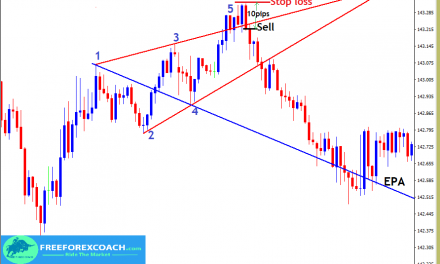
Daily Time frame
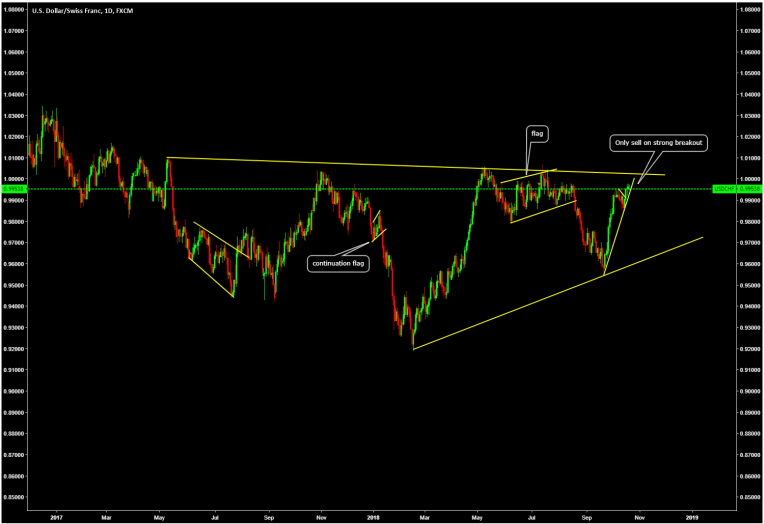
This analysis of structure drawing & pattern identification can be done to the lowest time frame of 15 minutes for us to come up with entry positions.
Remember to use Risk to reward ratios correctly when trading and trade using stops. You can however avoid the use of stops only if you are sitting in front of your screen for many hours and know how to manage your trades.
All the best and keep practising. You will get there.


