
Support and Resistance Summary is an overlook of what we covered in previous lessons.
Trading support and resistance is the easiest strategy to trade especially if you are new to trading. All you need is to point out the strong support levels and trade when price breaks or bounces off these levels.
Like any other strategy, always set your stop loss targets to limit your losses in case of anything.
Now let’s have a support and resistance summary on what we covered in detail
How to trade support and resistance summary
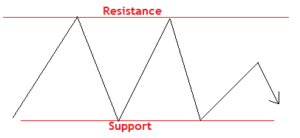
As you try to analyse your charts, looks for levels on the chart where price keeps bouncing back every time it reaches.
When it happens more than twice when price is moving up, that is a resistance.
In case the same thing happens when price is falling, that is a support.
As it makes the zigzag movements, draw horizontal line to identify the pivot points and compare it with the past price level to see if price held on the same level,previously.
Either way, price tends to consolidate on these levels on the chart sometimes showing no specific direction.
At this point, prepare for either a breakout or a bounce.
If price bounces back from the identified level prepare for an entry at the close of the confirmation candlestick.
However, if price breaks, you can take a buy position at the close of the breaking candlestick or after a retest back for the conservative traders.
Last but not least, when price breaks a major support, it becomes a new resistance and the same happens to the resistance, it becomes a new support.
NB. Always mind where you place your stop loss. Your stop loss should not be set exactly on the support or resistance level. Otherwise you will be knocked out of the market on a short notice.
Trend lines
Trend lines are tilted support and resistance.
When trading a down trend, draw your trendline above the price while in an uptrend, draw a trend line below the price.
To draw a trend line, you must have atleast two points or more.
The more times the price touches the trend line the stronger it becomes.
Never try to force a trend line to fit, if it does not fit on the chart it’s invalid.
Channels
These are two parallel trend lines drawn on a trend. One above price and the other below price. The upper boundary works as a resistance as the lower boundary as a support.
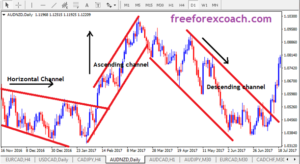
There are 3 types of channels
- Ascending channel for an uptrend
- Descending channel for a down trend
- Horizontal channel for sideways trend.
You can trade Support and resistance , Trendlines, and Channels in two ways.
- A breakout on the support and resistance level.
- A bounce/reversal on the support and resistance level.
You can enter a trade in 2 ways
- At the confirmation of the breaking candlestick (aggressive trader)
- wait for a retest after the break of the support or resistance level (conservative trader).
Lastly, conservative trading may save you from fake out signals. However you may miss out on potential trades because not all the time will price pull back or retest these levels.

How procrastination can affect your trading success?
Procrastination to trade is when your trading set up confirms and you hesitate to take trade. Or your trade show all failing signals and you hesitate to close trade to cut losses. Also, in cases, where you sometimes hesitate to take profit because you want to...
- Oh, bother! No topics were found here.

