
You can identify Trend Reversals in Forex by observing several factors. A reversal simply means change in direction.
Therefore a Trend reversal is change in the direction of price movement or entire trend. A downtrend changes into an uptrend or vice versa.
First let’s clearly define a trend.
What is a trend in forex trading
A trend is a tendency for prices to move in a particular direction over a period.
When the market is more bullish or price moves in the upward direction, it is an uptrend.
An uptrend makes higher highs and higher lows. A trend on a larger time frame is more reliable.
On the other hand, when price is more bearish or moves to the downside for a certain period, it is a downtrend.
A downtrend makes lower lows and lower highs.
Let’s see an example below;
Price tends to reverse after attaining its overbought and oversold levels.
In this lesson, we will discuss ways on how to identify trend reversals in forex.
What is a trend reversal
As earlier mentioned, A trend reversal is a change in the direction of a price trend. Trend changes from downtrend to an uptrend or vice-versa.
Signs to help you identify trend Reversals in Forex
- As price nears end of a trend, most times it forms tops and bottoms patterns as a sign of weakness in the trend.
- In case you are using indicators such as moving averages, Parabolic SAR, you are likely to see crossovers in the indicators.
- Similarly, you will notice a reduction in the price volume and momentum. These are clear red flags before you that signal a possible reversal in the trend.
- Price is also likely to reverse on levels of support and resistance or trend lines.
- The appearance of reversal candlestick patterns on these levels always give a strong confirmation for a trend reversal.
When candlesticks like shooting stars, doji, hammer, engulfings and stars form on support and resistance, it is always important to watch out for the next move.
Let’s have a look at an example on the chart below on AUDNZD, Daily time frame.
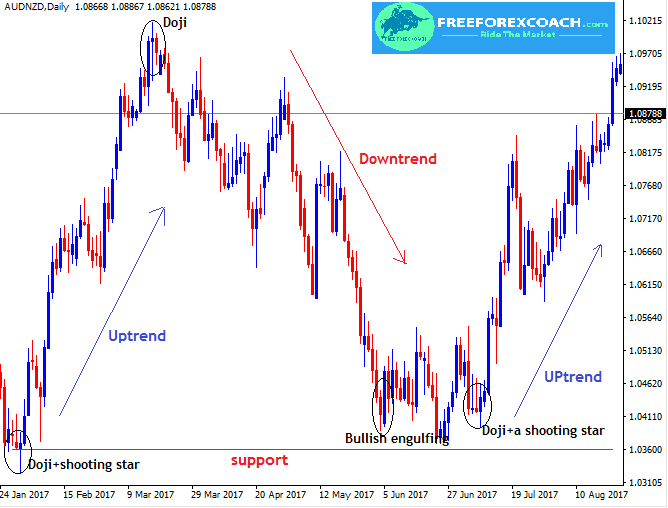
So from above chart, Can you identify a trend reversal?
Take a closer look at the candlestick reversal patterns formed at support and resistance zones.
Once you learn how to spot a reversing trend, you will be able to prepare for the possible changes in the market.
If you notice any of the indicators on an open position, its time for you to close trade and prepare for the new trend.
Downtrend reversal
For a downward trend to reverse, price falls to a point where it is likely not to be accepted in the market.
A further fall in prices, sellers are not willing to sell. Their stock or currency is being under valued causing most of the sellers to give up on the market.
As a result demand becomes greater than supply causing imbalance of supply over demand.
This causes a reversal in favor of buyers( uptrend).
Uptrend reversal
For an uptrend to reverse, prices must rising up to a point where buyers are not willing to buy at any additional raise in prices.
This will ultimately lead to price fall. Currency is over valued causing more of the buyers to give up and wait to buy when prices fall.
This reduces on the strength of the buyers in the market hence supply exceeds demand due to expensive prices.
As the sellers out number buyers, it will cause a panic in investors to sell their currencies high.
This is likely to cause a sharp fall in prices as more sellers get into the market.
How to identify trend reversals in the market?
Some of the ways to identify trend reversals in forex are;
Study price action in the current market trend.
- Look at the weaknesses in the trend movements. If price was making higher highs and higher lows in an uptrend but starts to make lower highs and lower lows its an indication that a trend is likely to change direction.
- The appearance of small candlestick patterns in the trend especially on the levels of support and resistance.
- Namely; shooting stars, doji, hammer, spinning tops and stars. This is also an indication of indecision or equal powers between the buyers and sellers. The strongest determines the direction of the trend.
- Indicators showing over bought and oversold conditions
- Also crossovers of the moving averages or parabolic SAR
Take a look at the AUDNZD, Daily chart below
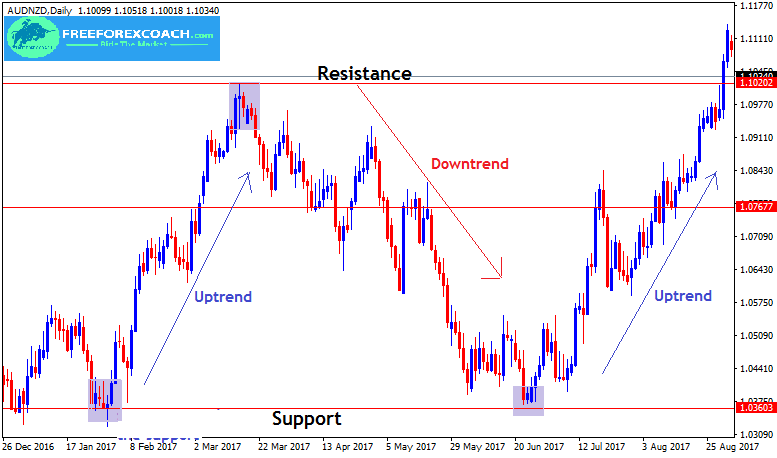
The chart above shows trend reversals at the levels of support and resistance.
The blue arrows shows price movement in an uptrend and the red arrow shows a downtrend.
So as price comes back to these zones especially after a trending movement, it likely reverses. This means that these are important levels to watch.
You will be able to prepare for the probable changes in the market in case you are holding an open position or prepare for new coming opportunities.

How Does Greed Impact your Forex Trading Success?
There are several ways greed can impact your Forex trading success. Firstly, greed can make you abandon your well crafted trading strategy in favor of impulsive and speculative actions. Instead of adhering to predetermined entry and exit points based on technical or...
-
- Topic
- Voices
- Last Post
-
-
Trading preparation routine!
Started by:
in: Trading Discussions
- 1
- 4 years, 8 months ago
-
Consistency in Trading
Started by:
in: Trading Discussions
- 2
- 5 years, 2 months ago
-
Consistency and Trading Discipline
Started by:
in: Community
- 1
- 5 years, 3 months ago
-
choosing a broker to deal with for forex trading
Started by:
in: Broker
- 4
- 5 years, 4 months ago
-
Strategies for Profiting on Every Trade – Oliver Velez
Started by:
- 1
- 5 years, 5 months ago
-
Setting Stop Loss and Take Profit Levels.
Started by:
- 4
- 5 years, 5 months ago
-
cutting losses
Started by:
- 3
- 5 years, 5 months ago
-
Trading a real account
Started by:
in: Beginner’s Questions
- 6
- 5 years, 7 months ago
-
How to determine forex quotes
Started by:
in: Beginner’s Questions
- 3
- 5 years, 7 months ago
-
Forex trading
Started by:
- 4
- 5 years, 7 months ago
-
What is forex trading
Started by:
- 4
- 5 years, 9 months ago
-
What are the best indicators of trend direction?
Started by:
in: Trading Discussions
- 2
- 5 years, 9 months ago
-
Good time to trade
Started by:
- 4
- 5 years, 11 months ago
-
Forex trading
Started by:
- 3
- 5 years, 11 months ago
-
Forex Trading
Started by:
- 1
- 5 years, 11 months ago
-
Forex Trading.
Started by:
- 2
- 6 years ago
-
Forex Brokers That Offer Crypto currencies
Started by:
- 2
- 6 years, 2 months ago
-
Ernst & Young's Financial Planning Essentials
Started by:
- 1
- 6 years, 2 months ago
-
Trading preparation routine!

