

In this USDCHF & USDJPY Technical Analysis article, we shall focus on the 1 Hour Time-Frame.
Let’s start by looking at each of these pairs with similar pattern formations on the hourly timeframe.
USDCHF Technical Analysis – H1 Chart
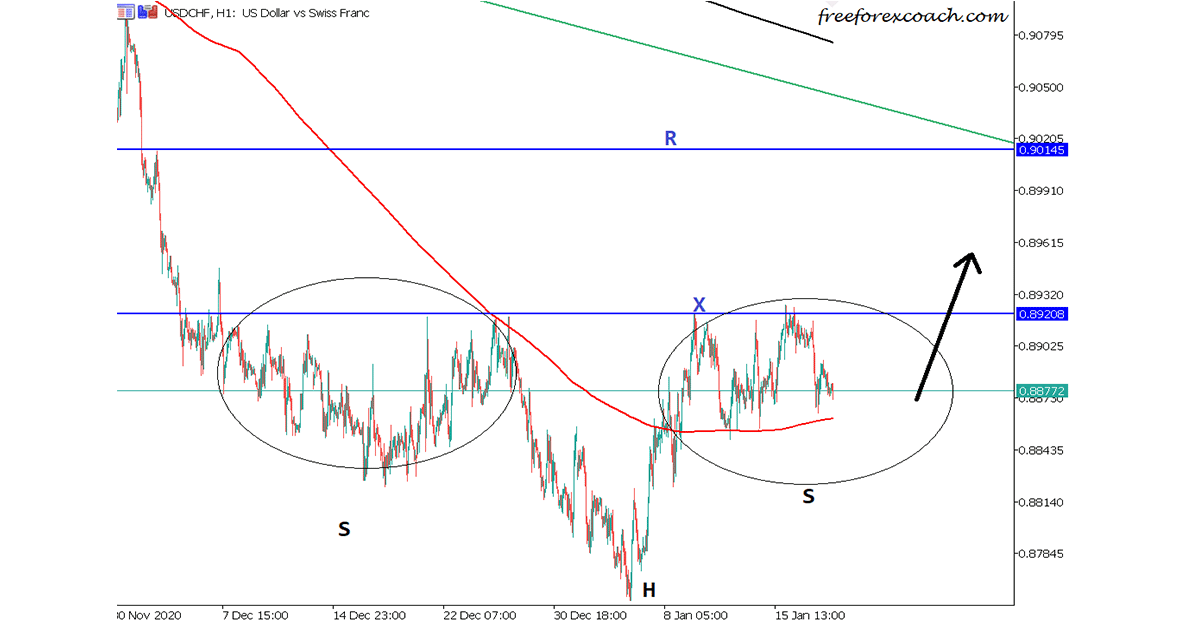
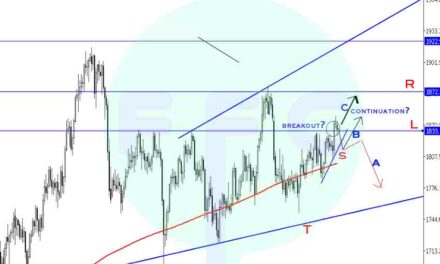
From the USDCHF, H1 chart above, the price looks like its forming a Reverse Head and Shoulders formation.
If you look at how big or the amount of the time the left shoulder took to form in comparison with the right shoulder. It clearly shows there is still room for more congestion before a good break out confirmation
Confirmation will be candle break and close above Resistance X. Target is around 0.90145 resistance marked horizontal line R. Stop loss a few pips below the right shoulder
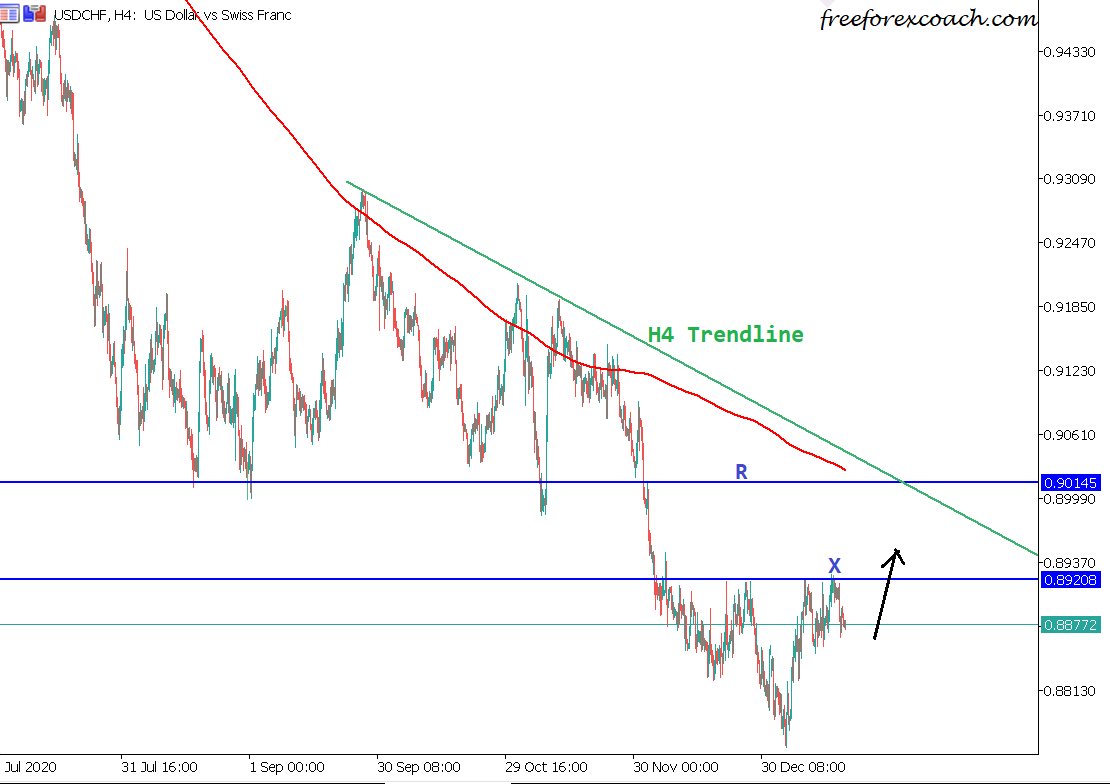
This resistance zone also coincides in the same zone as the H4 trendline shown in the chart below. This makes it a strong pivotal zone to watch for next movement
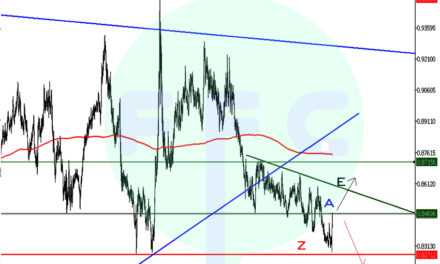
USDCHF H4 Chart
The chart below show the trendline resistance zone coinciding with the horizontal support zone
Since we are doing both USDCHF & USDJPY technical analysis, let’s now take a look on the USDJPY H1 pattern formation
USDJPY Technical Analysis – H1 Chart
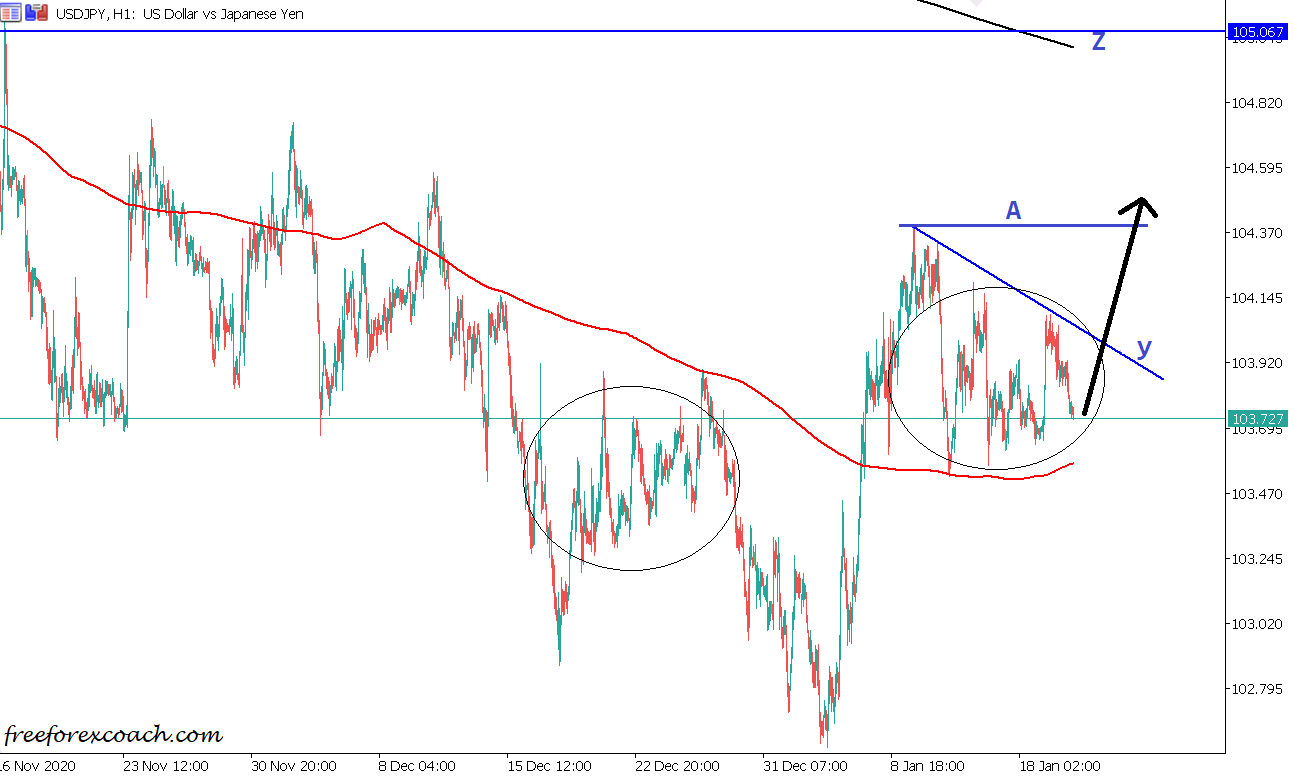
These 2 pairs (USDCHF & USDJPY) are positively correlated. Just lookin at the above USDJPY Hourly Chart, it also has a Reverse Head and Shoulders formation.
Comparing the size of the left shoulder and the right shoulder, the right is still small. This indicates that we may have a chance for a longer congestion before breakout confirmation
On breakout confirmation, you may wait for the traditional neckline break (A) or you can observe breakout and close above that small trendline y especially if the size of the shoulders is comparable.
If it breaks and closes above small trendline y too early i.e when shoulder still small, we could have deeper retests before movement to target.
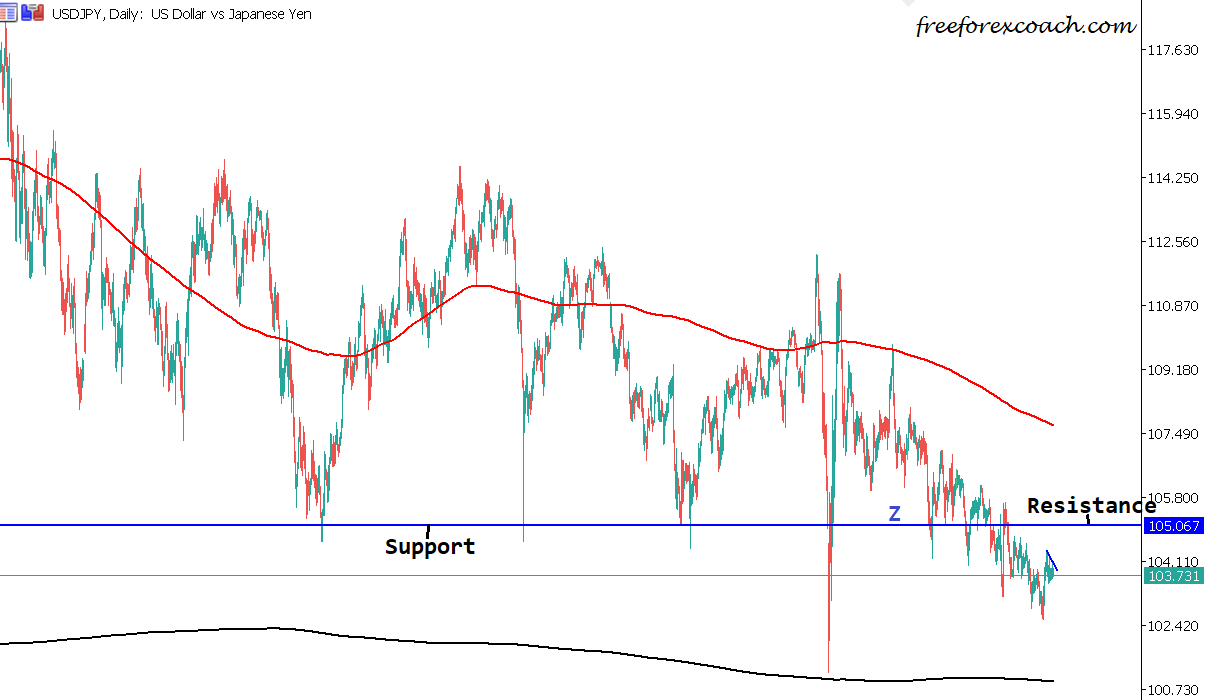
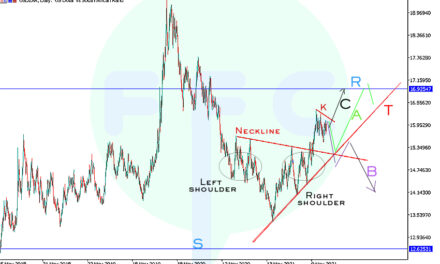
Target zone is around 105.067 resistance zone marked by horizontal line Z. This was a larger support daily zone broken turned resistance. Use a traditional stop loss on this.
USDJPY Daily Chart Large support Turned Resistance
Conclusion
The ideal way to trade technical patterns like head and shoulders is to look for balance in the pattern. In this case for the head and shoulders, compare the size of the shoulders.
Comparable shoulder sizes give strong movements with very minimal false break outs

