
Today’s analysis will be about the major levels to look for on the USDJPY Hourly chart. The analysis is similar to previous AUDNZD outlook.
But Before we dive into that, let’s first have a look at bigger timeframe to actually show you the cause of my bias on this.
My bias largely on the downside though no confirmation yet, so we shall look at levels that could confirm this bias in this article.
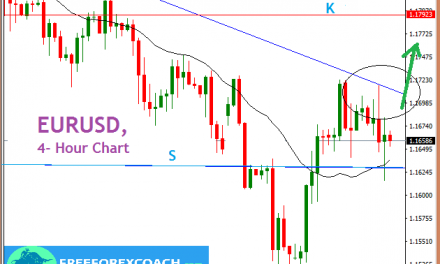
USDJPY 4-Hour Chart
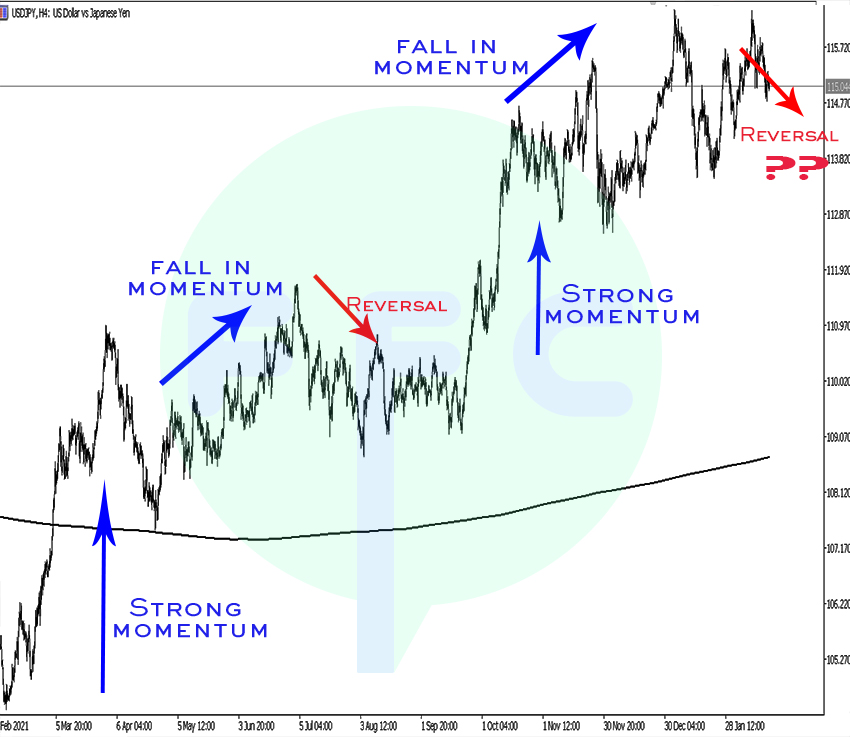
Looking at the H4 chart above. There is slowdown in general price momentum.
A change in price momentum could indicate price reversal or price pause/congestion. Its an exchange of power between bulls and bears shown by price movement
So, from the above chart, you can see when there is fall in momentum, there a price/pause reversal. Currently we have a price momentum change, so could we have a reversal?
let’s now look at the hourly chart for levels to focus on
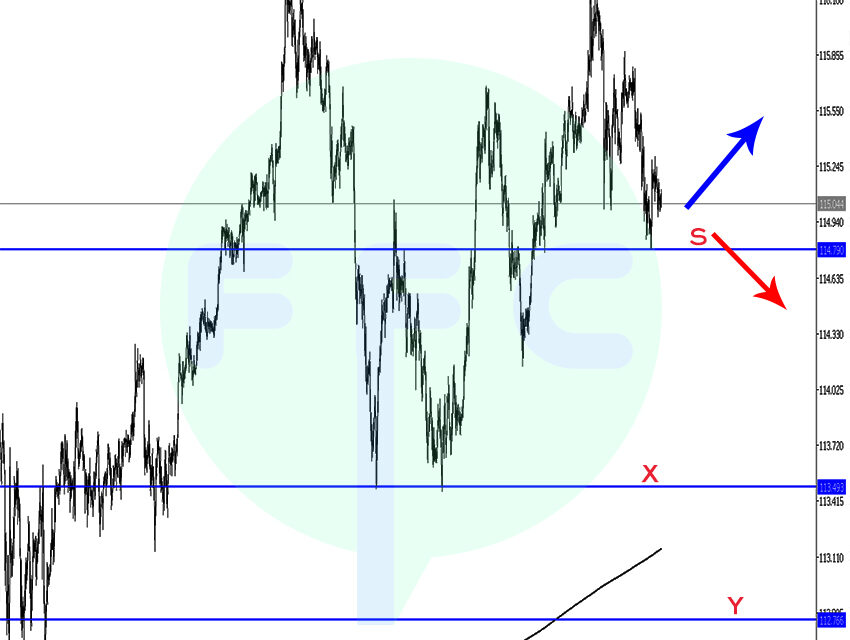
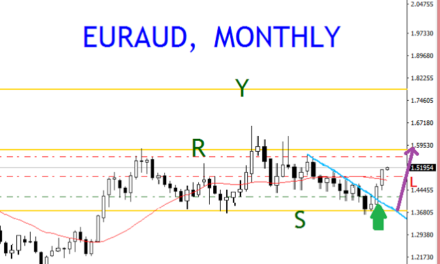
USDJPY Hourly Chart
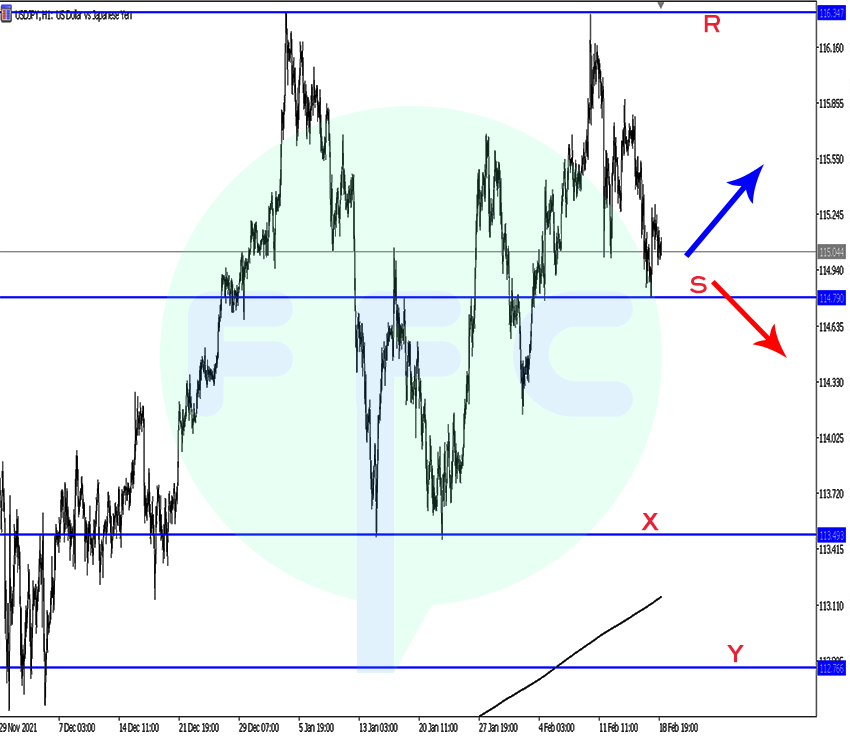
Keep close eye on resistance zone marked with horizontal line R and Support zone marked with horizontal line S.
Candle close below support zone S, could see price fall into next major support zone marked X. Depending on the reaction on this support zone, we may have more downside fall into next support zone marked Y.
On the other hand, if prices goes back up and closes beyond resistance zone marked R, setup is disqualified.
Points to Note
A change in momentum doesn’t definitely mean a price reversal, but it could indicate pending price movement change. This could be a reversal or price congestion
Very important to wait for candlestick close confirmations. The candle must actually close beyond the level not just touch or tail break. Its the body close that confirms break.
Once more, candle close beyond reistance zone marked with horizontal line R disqualifies setup
Happy Trading!

