
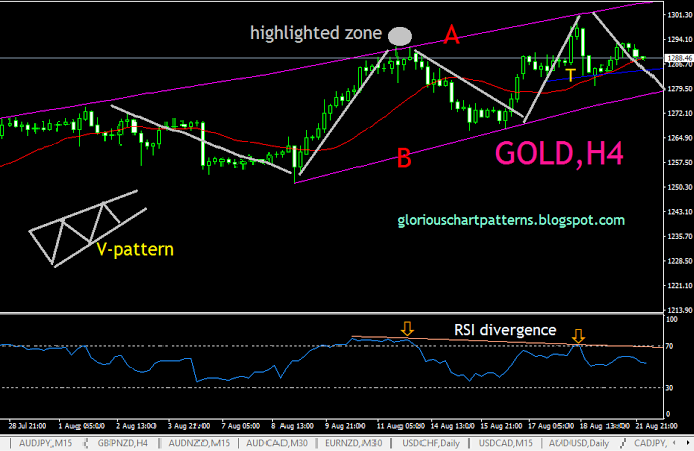
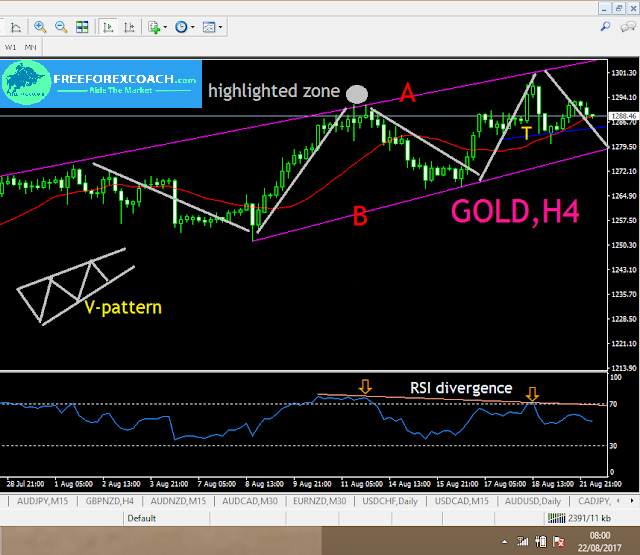
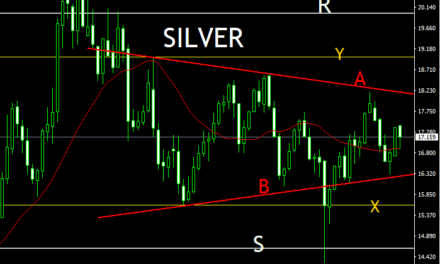
Gold has run into a channel as it hits the large daily resistance. The channel can be clearly viewed on the 4-hour chart below.
In our previous analysis, we discussed the V pattern movement on gold. In case you didnt follow it up, you can check it here.
V patterns are common congestion price movements especially when price lands into major support/resistance zones
Price in the channel is moving in clear V patterns. Therefore, the most likely next move is a more push to the downside to test the lower level channel trendline B.
The price on the 4-hour chart is now mid channel holding on the 21 Simple moving Average support.
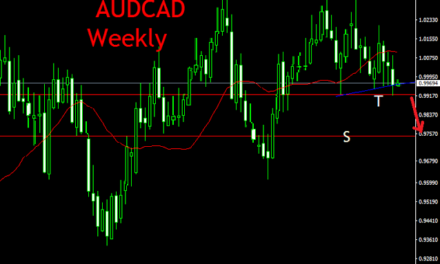
A Candle close below SMA may land into that small blue trendline support marked T. Conversely, a close below T may give us the ultimate push through to retest B trendline support.
If price breaks the channel on the downside, and retests the lower channel without price beating the highlighted high, which is mostly likely to be on the daily 21 SMA. If that happens, we may have a larger daily correction.
But for now, lets keep it within the channel as we await the price action
H-4 Hour Technical Analysis

